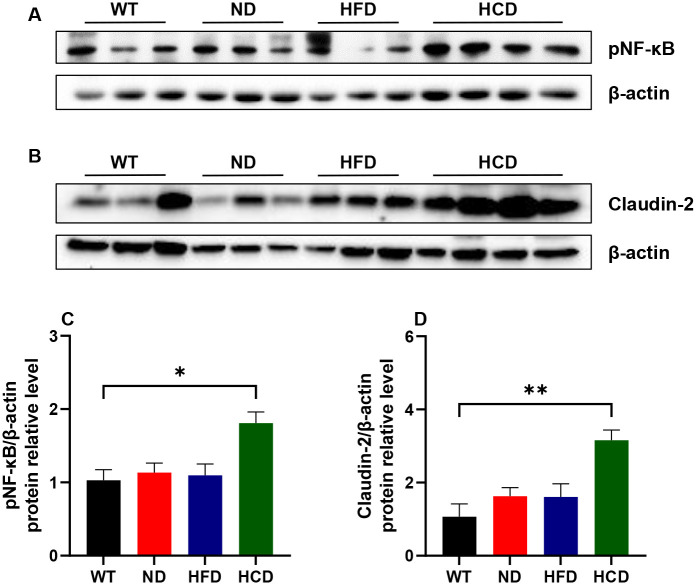
Fig 6. The expression of NF-κB p65 and Claudin-2.
Representative images of NF-κB p65 (A) and Claudin-2 (B) expression in the colon by western blot analysis. The relative densities of NF-κB p65 (C) and Claudin-2 (D) were calculated relative to β-actin expression. The data for each group is represented as the mean ± SEM. (n = 6–7) *P < 0.05; **P < 0.01. (Kruskal-Wallis test).

