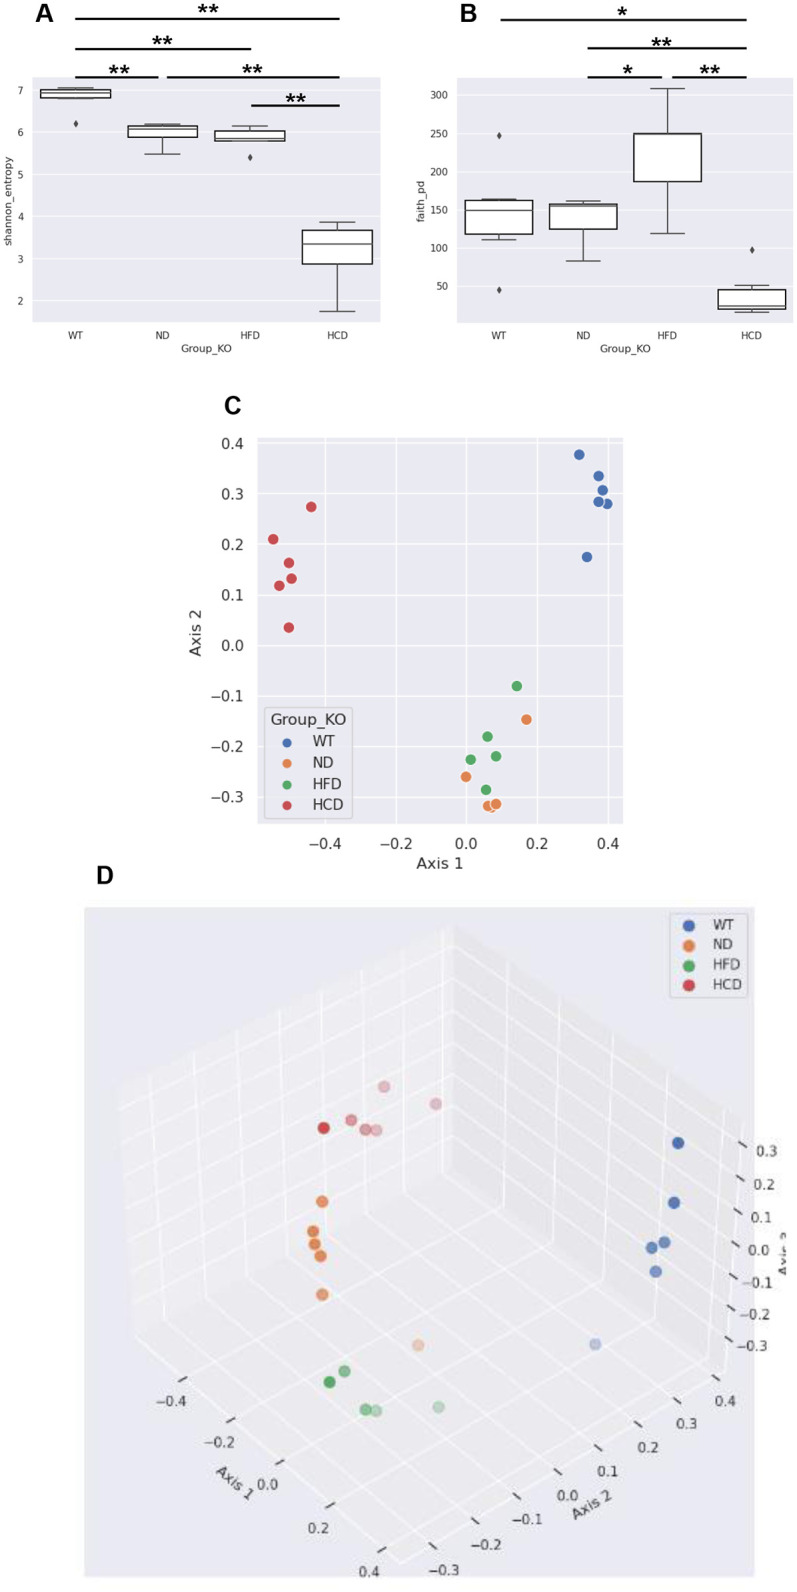
Fig 7. Characteristics of the bacterial community between groups.

Comparison of the colonic mucus bacterial community between groups. (A) Shannon index of each group; (B) Faith-PD index of each group; (C) Bray–Curtis distance of each group, 2D; (D) Bray–Curtis distance of each group, 3D. Data of quantitative analyses are represented as the mean ± SEM. (n = 6–7) *P < 0.05; **P < 0.01. (Alpha diversity: Kruskal–Wallis test; Beta diversity: PERMANOVA).
