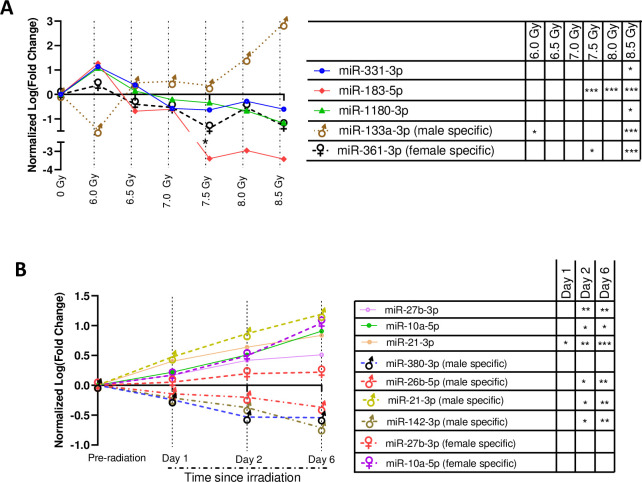
Fig 4. Putative miRNA markers of irradiation.
All miRNAs sequentially and functionally conserved between humans and NHPs. (A) Time since irradiation (TSI)-independent, radiation dose (RD)-miRNA markers. Here, the x-axis and y-axis represented the radiation dose and normalized log2 (Fold change), respectively. The fold changes were computed on the pre-irradiation baseline controls. All these miRNAs displayed a consistent shift (p < 0.05 in linear regression curve) across dosimetry independent of TSI. * p < 0.05; *** p < 0.001. (B) RD-independent, TSI-miRNA markers. Here, the x-axis and y-axis represented the TSI and normalized log2 (Fold change), respectively. The fold changes were computed on the pre-irradiation baseline controls. All these miRNAs displayed consistent shift (p < 0.05 in linear regression curve) across TSI. * p<0.05; ** p<0.05; *** p<0.001.

