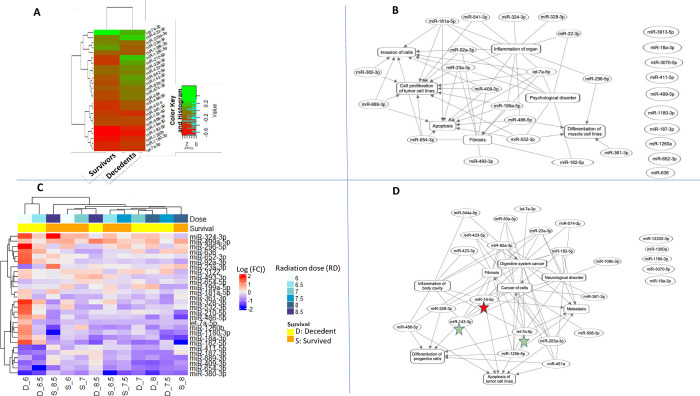
Fig 6. Functional association among the differentially expressed miRNA cluster linked to RRiF.
The color keys of log2 (Fold change) were added at the top left corners. In these networks, the oval and rectangular shaped nodes represented miRNA and biofunctions, respectively. The edges represented the relationship between two nodes, the solid lines represented their association, and pointed arrowheads denoted the activating relationship between the two nodes. Red colored stars annotate miRNAs that were most connected to the neighbors for > 90% percentile, and green colored stars for > 75% percentile. (A) Hierarchical cluster of 21 differentially expressed miRNAs linked to RRiF. (B) Network cluster of the same 21 differentially expressed miRNAs linked to RRiF. (C) Hierarchical cluster of 28 differentially expressed miRNAs linked to the cumulative effects of radiation dose and RRiF. (D) Network cluster of the same 28 differentially expressed miRNAs linked to RD*RRiF.

