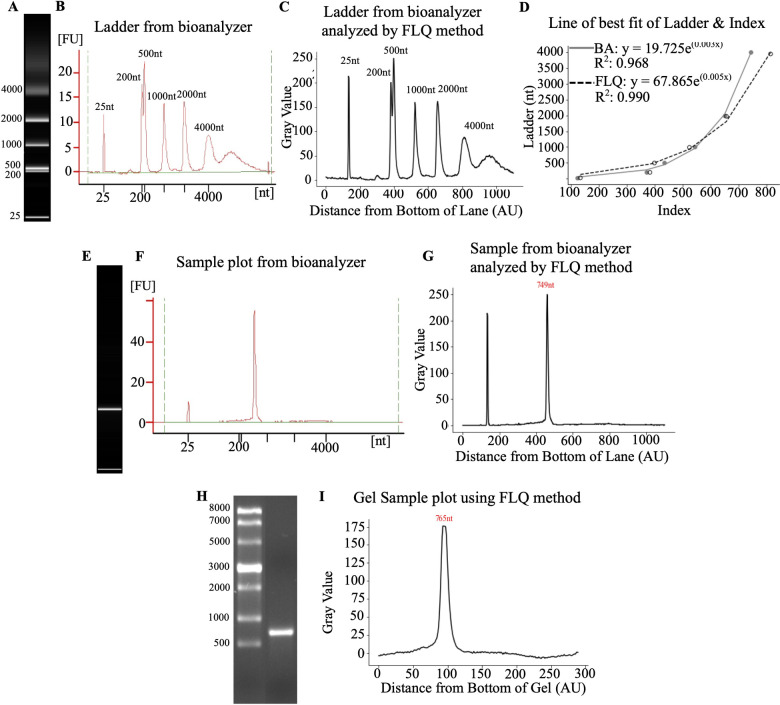
Fig 6. Comparison of FLQ to bioanalyzer.
A) The image of the ladder obtained from the bioanalyzer. B) Ladder profile obtained from bioanalyzer C) Ladder profile of bioanalyzer image obtained using FLQ. D) Line of the best fit using both methods with the bioanalyzer (BA) data in gray and the FLQ as the dotted line. E) mRNA sample image from bioanalyzer chip. F) Quantification profile using a bioanalyzer. G) Quantification profile of bioanalyzer image using FLQ. H) Gel electrophoresis image of the sample. I) Quantification of gel electrophoresis image using FLQ. Bioanalyzer data was obtained using 2100 Expert (B.02.08.SI648).

