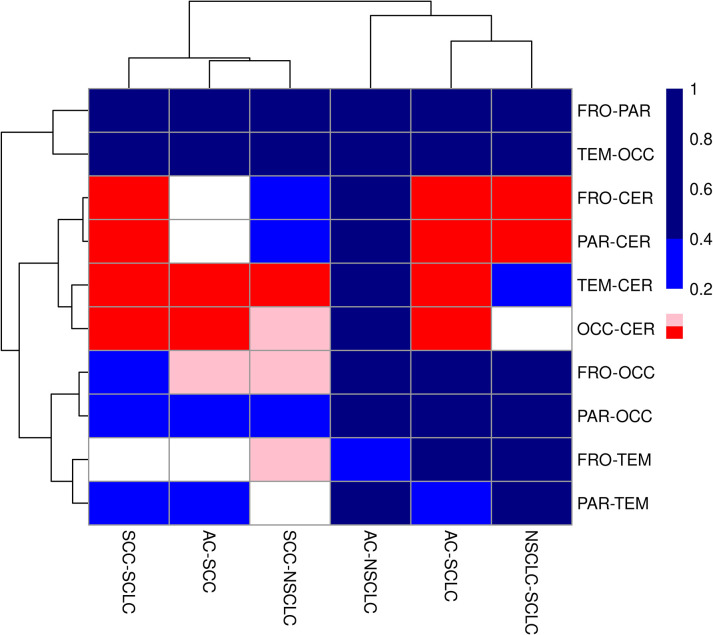
Fig 4. Clustered heatmap showing the p-values calculated by Fisher’s exact test for all each pairing of neuroanatomical location and lung cancer subtype.
Neuroanatomical location abbreviations: FRO = frontal lobe, PAR = parietal lobe, TEM = temporal lobe, OCC = occipital lobe, CER = cerebellum. Lung cancer subtype abbreviations: AC = adenocarcinoma, SCC = squamous cell carcinoma, SCLC = small cell carcinoma, NSCLC = non-small cell carcinoma-NOS. The colours represent different p-value ranges: red is p = 0 to <0.05, pink is p = 0.05 to <0.1, white is p = 0.1 to <0.2, light blue is p = 0.2 to <0.4 and dark blue is p = 0.4 to 1.0.

