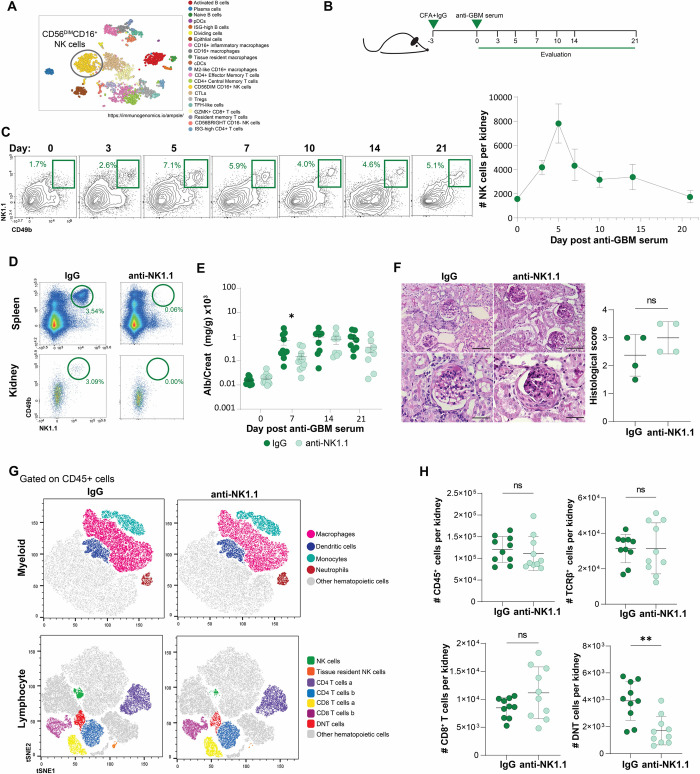
Fig 1. NK cell abundance increases in kidneys in response to deposited ICs.
(A) Cell clusters identified based on single-cell transcriptional analysis in kidneys from patients with SLE, performed by the AMP Consortium, where NK cells represent a significant population of the hematopoietic cells. Identity of the clusters are specified on the right. (B) Experimental approach of the nephrotoxic nephritis model. (C) Evaluation of NK cells in kidneys upon nephritis induction at the indicated days and absolute NK cell numbers (n = 4–7). (D) Representative plots of NK cells in spleen and kidneys after 7 days of treatment with IgG or anti-NK1.1 antibody. (E) Albuminuria after nephritis induction *p = 0.0305, unpaired t-test. (F) Histological analysis of kidneys of control mice or NK cell-depleted mice; scale bars 80μm (upper panels), and 40 μm (lower panels) (G) Flow cytometry analysis of hematopoietic cell infiltrates in the kidney after nephritis induction in the indicated groups. (H) Total numbers of kidney infiltrating CD45+ cells, T cells, CD8+ T cells and DN T cells in control and NK cell-depleted mice at day 7 of nephritis induction, **p = 0.0011, unpaired t-test.

