. 2024 Nov 1;13:e98096. doi: 10.7554/eLife.98096

Figure 2. FGF8-mediated regulation of target gene expression in FOXG1+ telencephalic organoids.

(A) Schematic of the hybrid 2D/3D method for applying FGF8 treatment on telencephalic/cortical human organoids in vitro. FGF8 (100 ng/mL) was added to the neural progenitor patterning medium (NPPM) beginning on day10-11 (blue bar) and maintained through subsequent culture steps until approximately day50-60. (B) Real-time qRT-PCR analysis of FGF8 target gene expression (SPRY4, DUSP6, ETV4, ETV1, and ETV5) in day20 and day30 organoids treated with WNT inhibition alone (WNTi) or in combination with FGF8 (WNTi + FGF8), as indicated. n=3 organoids per condition, pooled prior RNA extraction. (C) Real-time qRT-PCR quantification of FOXG1 (telencephalic marker) and NR2F1 (caudal telencephalic marker and FGF8 target) expression in day20 and day30 control (CTRL), WNT-inhibited (WNTi), and FGF8-treated (WNTi + FGF8) samples, as indicated. FGF8 treatment effectively downregulates NR2F1 expression in WNTi + FGF8 organoids compared with WNTi organoids. n=3 organoids per condition, pooled prior RNA extraction. (D–F) Immunostaining for FOXG1 (red) and SOX2 (green) in day35 WNTi and WNTi + FGF8 organoids, as indicated. FGF8 treatment does not significantly alter FOXG1 expression. White arrowheads in high-magnification images indicate SOX2+ NR2 F1+ NPs within rosettes. Graph (F) shows pixel intensity quantification of FOXG1 staining in WNTi and WNTi + FGF8 organoids at different time points. n≥8 sections from n≥4 organoids from n≥2 distinct batches. (G–I) NR2F1 and NTUB (red and green, respectively, in G-H’) immunostainings on day35 WNTi and WNTi + FGF8 organoids, as indicated. FGF8 treatment efficiently modulates NR2F1 expression (compare G and H). High-magnification images (G’ and H’) show neural rosettes (NTUBlow, indicated by white arrowheads) and differentiating neurons (NTUBhigh, indicated by white arrows), both expressing NR2F1 (red) in WNTi organoids, but lacking NR2F1 in WNTi + FGF8 organoids. Graph (I) displays pixel intensity quantification of NR2F1 staining in WNTi and WNTi + FGF8 organoids over time. n≥6 sections from n≥4 organoids from n≥2 distinct batches. Scale bars: 100 µm.

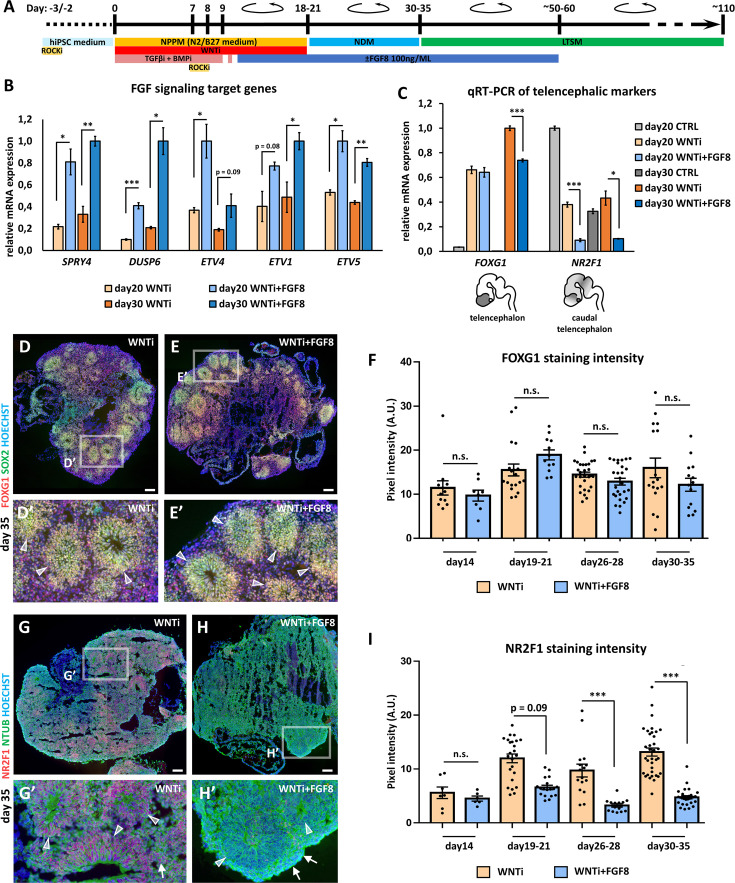
Figure 2—source data 1. Quantitative RT-PCR data for FGF target genes in human organoids.
Raw data of FGF target gene expression in day 20 and day 30 CTRL, WNTi, and WNTi +FGF8 organoids.
Figure 2—source data 2. Quantitative RT-PCR data for FOXG1 and NR2F1 in human organoids.
Raw data showing FOXG1 and NR2F1 expression levels in day 20 and day 30 CTRL, WNTi, and WNTi + FGF8 organoids.
Figure 2—source data 3. FOXG1 staining intensity in WNTi and WNTi + FGF8 human organoids.
GraphPad sheet with raw pixel intensity data from day 14 to day 35, measured in WNTi and WNTi + FGF8 organoid cryostat slices following FOXG1 immunostaining.
Figure 2—source data 4. NR2F1 staining intensity in WNTi and WNTi + FGF8 human organoids.
GraphPad sheet with raw pixel intensity data from day 14 to day 35, measured in WNTi and WNTi + FGF8 organoid cryostat slices following NR2F1 immunostaining.

Figure 2.

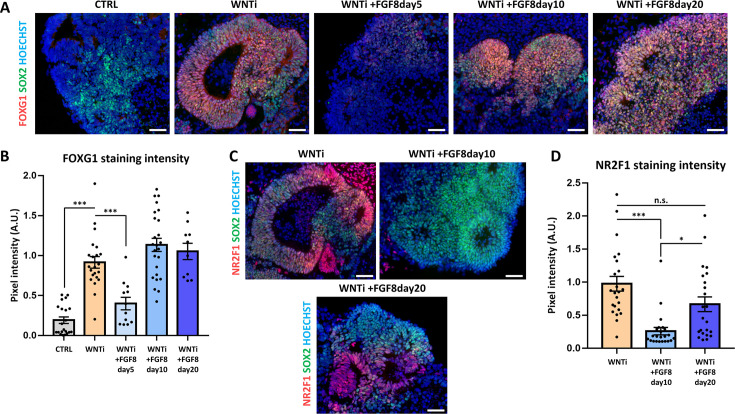
Figure 2—figure supplement 1. Effect of early or late FGF8 treatment on FOXG1 and NR2F1 expression in human organoids.

Figure 2—figure supplement 1.

(A,B) Panel showing FOXG1 (red) and SOX2 (green) immunostaining in control (CTRL), WNT inhibited (WNTi) and FGF8 treated (WNTi + FGF8) day 30 organoids, as indicated. FGF8 was added at day5, at day10 or at day20; when added at day5, FGF8 partially inhibited FOXG1 expression, suggesting interference with induction of telencephalic identity (pixel intensity in graph B). (C,D) Panel showing NR2F1 (red) and SOX2 (green) immunostaining in WNT inhibited (WNTi) and FGF8 treated (WNTi + FGF8) day 30 organoids, as indicated. FGF8 treatment starting at day10 efficiently downregulated NR2F1, while treatment starting at a later time point (day20) failed to restrain NR2F1 expression (pixel intensity in graph D). For both graphs in B and D: n≥8 sections from n≥4 organoids from n=1 batch. Scale bars: 50 µm.
Figure 2—figure supplement 1—source data 1. FOXG1 staining intensity following early or late FGF8 treatment.
GraphPad sheet with raw pixel intensity data measured in CTRL, WNTi and WNTi + FGF8 organoids after FOXG1 immunostaining.
Figure 2—figure supplement 1—source data 2. NR2F1 staining intensity following early or late FGF8 treatment.
GraphPad sheet containing NR2F1 pixel intensity data for WNTi organoids and organoids treated with FGF8 at two distinct time points.
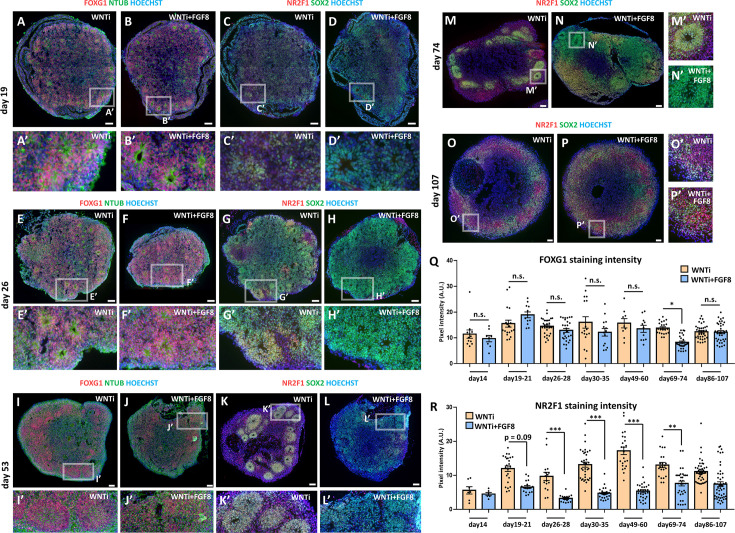
Figure 2—figure supplement 2. FGF8-mediated control of NR2F1 level in FOXG1+ telencephalic organoids.

Figure 2—figure supplement 2.

(A-H’) FOXG1 and NTUB (red and green, respectively, in A-B’ and in E-F’) and NR2F1 and SOX2 (red and green, respectively, in C-D’ and in G-H’) immunostainings on day19 or on day26 WNTi and WNTi + FGF8 organoids, as indicated. FGF8 treatment did not significantly interfere with FOXG1 expression (A-B’, E-F’), while NR2F1 (which started to be detectable at low levels by immunostaining at day19 in WNTi organoids) was down-regulated by FGF8 (compare C,C’ with D,D’ or G,G’ with H,H’). (I-L’) FOXG1 and NTUB (red and green, respectively, in I-J’) and NR2F1 and SOX2 (red and green, respectively, in K-L’) immunostainings on day53 WNTi and WNTi + FGF8 organoids, as indicated. (M-P’) NR2F1 (red) and SOX2 (green) immunostaining in day74 (M-N’) and in day107 (O-P’) WNTi and WNTi + FGF8 organoids, showing that NR2F1 is still efficiently modulated by FGF8 20–25 days after end of the treatment (N, N’) but is gradually upregulated back to control levels in long-term cultured organoids (day107; P-P’). (Q) Graph shows pixel intensity quantification of FOXG1 levels after immunostaining of WNTi and WNTi + FGF8 organoids at different time points, as indicated. n≥8 sections from n≥4 organoids from n≥1 batch. (R) Graph shows pixel intensity quantification of NR2F1 immunostaining in WNTi and WNTi + FGF8 organoids at different time points, as indicated. NR2F1 level was efficiently downregulated by FGF8 treatment from day26 to day74, while it raised back at later time points. n≥6 sections from n≥4 organoids from n≥1 batch. Scale bars: 100 µm.
Figure 2—figure supplement 2—source data 1. FOXG1 staining intensity in WNTi and WNTi + FGF8 human organoids.
GraphPad sheet with raw pixel intensity data measured in WNTi and WNTi + FGF8 organoids following FOXG1 immunostaining at different stages.
Figure 2—figure supplement 2—source data 2. NR2F1 staining intensity in WNTi and WNTi + FGF8 human organoids.
GraphPad sheet with raw pixel intensity data measured in WNTi and WNTi +FGF8 organoids following NR2F1 immunostaining at different stages.