. 2024 Nov 1;13:e98096. doi: 10.7554/eLife.98096

Figure 3. Single-cell RNA sequencing (scRNAseq) analysis of FGF8-induced cellular and molecular changes in human organoids.

(A) Experimental setup for scRNA-seq analysis of control (WNTi) and FGF8-treated (WNTi + FGF8) telencephalic organoids at day 69. Two independent batches of WNTi and WNTi + FGF8 organoids (each containing 2–3 organoids) were dissociated into single cells and processed using Chromium (10 X Genomics technology). Cells were clustered and visualized in 2D space using t-SNE and UMAP algorithms. (B) UMAP clustering of WNTi and WNTi + FGF8 cells, identifying 15 distinct clusters. (C) Expression levels of known markers for different cell types, including neural progenitor cells (NPs: NESTIN, SOX2, HES5), proliferating progenitors (KI67, TOP2A), intermediate progenitors (IPs: EOMES), apical and basal radial glia cells (aRGs and bRGs: HOPX, TNC, FAM107A, CRYAB), and differentiating/differentiated neurons (NEUROD4 and MAPT, respectively). (D) Trajectory analysis showing the most probable developmental progression from NP clusters (2, 5, 8, 9, 12, 15) to post-mitotic cell types (notably clusters 1, 3, 4, 6, 7). (E) Expression level and cluster distribution of dorsal glutamatergic markers EMX1 and SLC17A7 (also called VGLUT1) and ventral GABAergic markers GSX2 and SLC32A1 (also called VGAT), indicating the coexistence of both glutamatergic and GABAergic NPs and neurons within FOXG1+ telencephalic organoids. (F, G) UMAP clustering of WNTi and WNTi + FGF8 cells shown separately, illustrating 15 distinct clusters and their respective proportions in each condition. Panel (G) shows the number of cells in each cluster originating from WNTi (yellow) or WNTi + FGF8 (blue) organoids. (H) UMAP projection of day69 organoid scRNA-seq data, identifying four cellular groups through sub-clustering analysis on WNTi + FGF8 clusters 8 and 9. Center and right panels display expression levels of markers for the forebrain (FOXG1), ventral telencephalon (GSX2, ASCL1 and DLX2), forebrain/midbrain (OTX2), diencephalon/mesencephalon (IRX3), and mesencephalon (EN1, EN2) across the four sub-clusters. (I-I’’) Immunostaining for FOXG1 (red) and OTX2 (green) in day69 WNTi + FGF8 organoids, showing distinct FOXG1+ and FOXG1- regions. White arrows indicate FOXG1- OTX2+ non-telencephalic areas (high magnification in I’), while arrowheads denote FOXG1+ OTX2low telencephalic areas (high magnification in I’’). Ctx, cortex; MGE, medial ganglionic eminence; LGE, lateral ganglionic eminence.

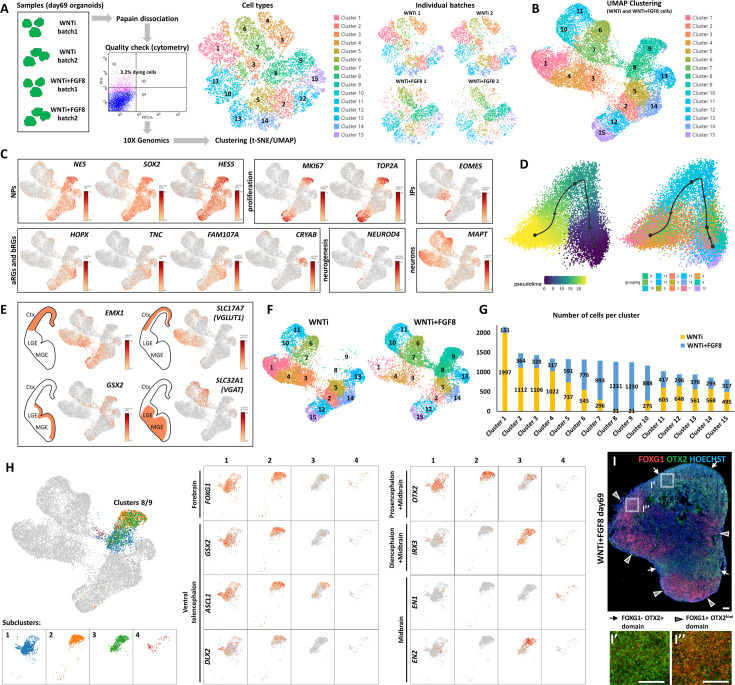
Figure 3—source data 1. Trajectory analysis for all cell clusters.
Detailed methods and data report of the developmental trajectory analysis for all cell clusters (15 clusters).
Figure 3—source data 2. Cell counts per cluster by origin (control WNTi or treated WNTi + FGF8 organoids).
Summary datasheet showing WNTi or WNTi + FGF8 cell counts per cluster, extracted via 10 X Genomics Loupe Browser.

Figure 3.

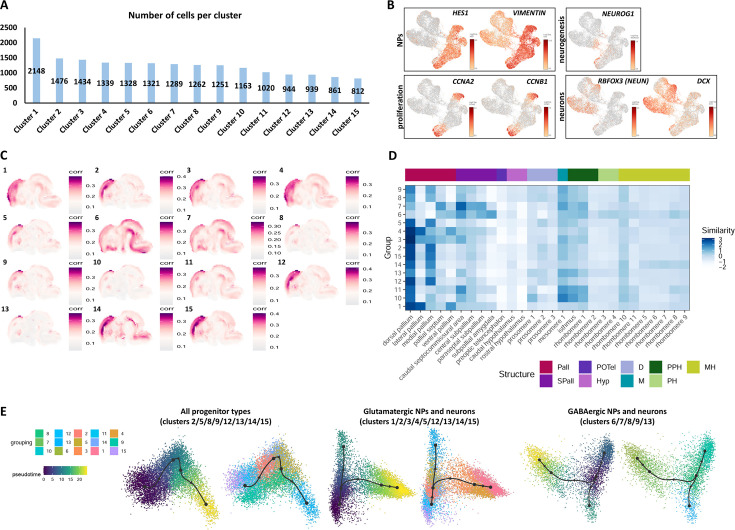
Figure 3—figure supplement 1. Single-cell RNA sequencing (scRNAseq) and VoxHunt similarity map analysis of 2-month-old telencephalic organoids.

Figure 3—figure supplement 1.

(A) Number of cells per cluster after scRNAseq of day69 organoids. (B) Expression level of known markers identifying neural progenitor cells (NPs; VIMENTIN and HES1), proliferating progenitors (CCNA2 and CCNB1), differentiating neurons (NEUROG1) and post-mitotic neurons (DCX and RBFOX3, also called NEUN). Additional markers are illustrated in Figure 3C. (C) VoxHunt similarity map showing similarity correlation index (white to violet) of each cluster to reference databases of mouse regional brain atlases. (D) VoxHunt heatmap of similarity score showing the similarity degree (blue color code) between the expression profile of clusters (lines) and distinct regions of the mouse embryonic brain (columns). Note the high similarity between clusters 1/2/3/4/5/12/14/15 and dorsal-anterior pallium (neocortex). Clusters 6 and 7, on the contrary, show high similarity to ventral subpallial regions (ganglionic eminences). Legend on the right shows the brain area associated to each color. Pall: pallium; Spall: Subpallium; POTel: Preoptic telencephalon; Hyp: hypothalamus; D: diencephalon; M: mesencephalon; PPH: Prepontine hindbrain; PH: Pontine hindbrain; MH: Medullary hindbrain. (E) Trajectory analysis evaluating the most probable developmental trajectory linking all cell progenitor clusters (left), glutamatergic NPs and neurons (center) or GABAergic NPs and neurons (right). NP clusters can either convert into one another (suggesting plasticity to switch between dorsal and ventral telencephalic identity), either differentiate into post-mitotic neurons. In all cases, progenitors can also enter in a developmental ‘bottleneck’ represented by cluster 13 (CRYAB+ truncated aRGs).
Figure 3—figure supplement 1—source data 1. Cell count per cluster from scRNAseq analysis of day 69 organoids.
Summary datasheet showing the number of cells per cluster, extracted via 10 X Genomics Loupe Browser.
Figure 3—figure supplement 1—source data 2. VoxHunt analysis report.
Detailed report on the methods and data for VoxHunt visualization.
Figure 3—figure supplement 1—source data 3. Trajectory analysis of progenitor cell clusters.
Detailed methods and data report on the developmental trajectory analysis for progenitor clusters (2, 5, 8, 9, 12, 13, 14, and 15).
Figure 3—figure supplement 1—source data 4. Trajectory analysis of glutamatergic clusters.
Detailed methods and data report for the trajectory analysis of glutamatergic progenitors and neurons (clusters 1, 2, 3, 4, 5, 12, 13, 14, and 15).
Figure 3—figure supplement 1—source data 5. Trajectory analysis of GABAergic clusters.
Detailed methods and data report for the trajectory analysis of GABAergic progenitors and neurons (clusters 6, 7, 8, 9, and 13).
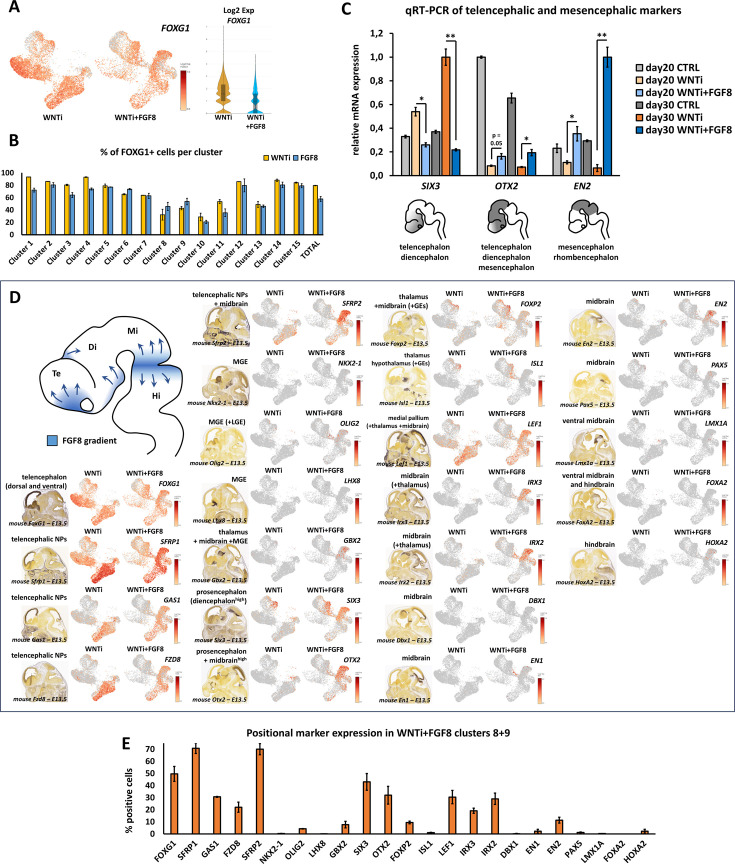
Figure 3—figure supplement 2. FGF8-dependent induction of diencephalic and mesencephalic markers in telencephalic organoids.

Figure 3—figure supplement 2.

(A, B) Expression level and percentages of positive cells per cluster for FOXG1 in control (WNTi) and treated (WNTi + FGF8) organoids, as indicated. Despite a partial reduction of FOXG1 average expression (A), most of the cells in different clusters still express FOXG1 after FGF8 treatment (B). (C) Real time qRT-PCR quantification of telencephalic/diencephalic (SIX3), prosencephalic/midbrain (OTX2) and midbrain/hindbrain (EN2) markers in day20 or day30 control (CTRL), WNT inhibited (WNTi) or FGF8-treated (WNTi + FGF8) organoids, as indicated. FGF8 induces loss of SIX3 expression and increase of diencephalon/midbrain markers (OTX2, EN2), suggesting that long term FGF8 treatment can induce additional -more posterior- regional identities together with FOXG1+ cells. n=3 organoids per condition, pooled before RNA extraction. (D) At the top left of the panel, an early fetal brain scheme shows FGF8 sources (blue) in the anterior telencephalon, in the diencephalon and at the midbrain/hindbrain border, and their presumable diffusing gradients (arrows). The panel illustrates expression levels of distinct brain regional markers in UMAP projections of WNTi or WNTi + FGF8 single cell RNA sequencing samples, as indicated. Mouse brain images at embryonic day (E) 13.5 obtained from the Allen Brain Atlas show the main domains where these markers are found. (E) Graph showing the percentage of cells expressing different markers (indicated on x-axis) in clusters 8 and 9 of WNTi + FGF8 organoids. Clusters 8/9 indicate high percentage of cells expressing telencephalic (FOXG1, SFRP1, GAS1, SFRP2) and diencephalic/midbrain genes (SIX3, OTX2, LEF1, IRX3, IRX2, EN2). Very few or no cells express markers for the medial ganglionic eminence (GBX2, LHX8, NKX2-1, OLIG2), for the ventral midbrain (FOXP2, ISL1, LMX1A, FOXA2) or for more posterior regions (HOXA2).
Figure 3—figure supplement 2—source data 1. Number of FOXG1+ cells per cluster.
Summary datasheet showing the number of FOXG1+ cells in each cluster, extracted via 10 X Genomics Loupe Browser.
Figure 3—figure supplement 2—source data 2. Quantitative RT-PCR data for telencephalic and mesencephalic markers in human organoids.
Raw data of SIX3, OTX2, and EN2 expression in day 20 and day 30 CTRL, WNTi, and WNTi + FGF8 organoids.
Figure 3—figure supplement 2—source data 3. Number of cells expressing distinct positional markers in clusters 8 and 9.
Summary datasheet of cells from clusters 8 and 9 expressing different positional identity markers, extracted via 10 X Genomics Loupe Browser.
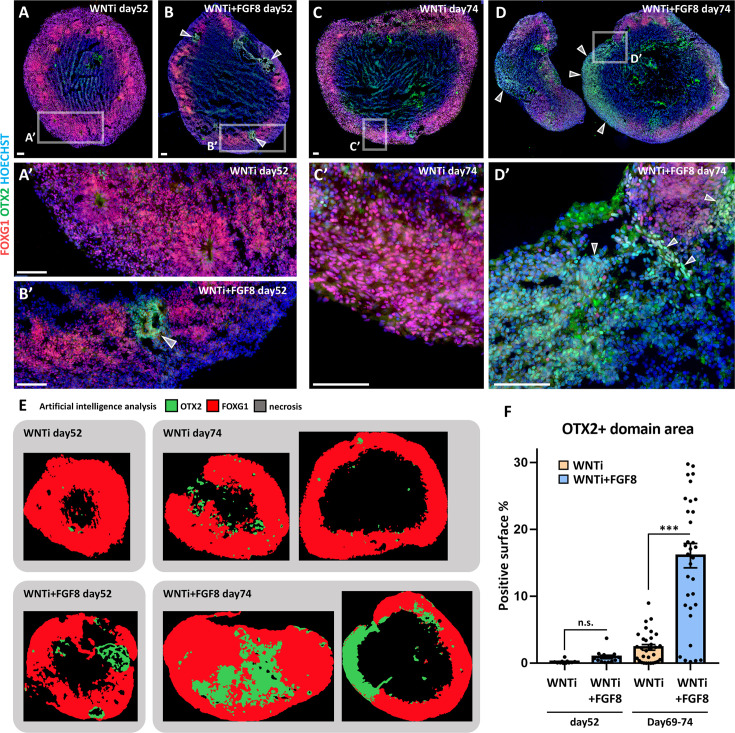
Figure 3—figure supplement 3. FGF8-dependent induction of OTX2+ domains in multi-regional organoids.

Figure 3—figure supplement 3.

(A-D’) FOXG1 (red) and OTX2 (green) immunostaining in control (WNTi; A, A’, C, C’) and treated (WNTi + FGF8; B, B’, D, D’) organoids, showing the presence of FOXG1+ telencephalic domains and of OTX2+ FOXG1- diencephalic/mesencephalic domains at day52 (A-B’) and at day74 (C-D’). White arrowheads point to FOXG1- OTX2+ non-telencephalic areas in FGF8-treated organoids (high magnifications in B’ and D’). (E, F) Artificial intelligence analysis by HALO software of marker distribution in day52 and in day74 control or treated organoids, as indicated. Exemplificative images of automatically detected OTX2+ (green), FOXG1+ (red) and necrotic (black) regions are illustrated. Graph in F shows the percentages of OTX2+ surfaces in organoid sections, at different time points as indicated (quantified by HALO software; n≥8 sections from n≥3 organoids from n≥1 batch for each time point).
Figure 3—figure supplement 3—source data 1. OTX2+ area percentages in multi-regional organoids.
GraphPad sheet with OTX2+ area percentages in WNTi and WNTi + FGF8 organoid cryostat slices from day 52 to day 74 following OTX2 immunostaining.