. 2024 Nov 1;13:e98096. doi: 10.7554/eLife.98096

Figure 4. Effects of FGF8 treatment on the dorso-ventral cellular composition of telencephalic organoids.

(A, B) Expression levels of markers identifying dorsal glutamatergic NPs and neurons (Panel A; EMX1, NEUROD6, SLC17A7) and ventral GABAergic NPs and neurons (Panel B; ASCL1, DLX1, GAD2). Black arrowheads highlight clusters with the most notable changes in marker and cell abundance after FGF8 treatment. (C,D) Expression levels of known markers identifying ventral GABAergic NPs and neurons in the lateral ganglionic eminence (LGE) (Panel C; EBF1, GSX2, MEIS2 and TLE4) and the medial ganglionic eminence (MGE) (Panel D; NKX2-1 and LHX8). Black arrowheads in C highlight clusters with the largest differences in LGE marker and cell abundance following FGF8 treatment. (E-F’) GAD1 (red) and SLC17A7 (green) immunostaining in day53 control (WNTi) and treated (WNTi + FGF8) organoids, as indicated. The distribution of these markers in vivo is shown in the brain scheme on the left. (G–I) HALO software artificial intelligence (AI) analysis of marker distribution in day53 and day74 organoids. Representative images display areas automatically identified as SLC17A7+ (green), GAD1+ (red), and necrotic (black). Graphs in H and I show the proportions of SLC17A7+ (H) and GAD1+ (I) surface areas in day 74 organoid sections, as quantified by HALO AI; n≥8 sections from n≥4 organoids from n=1 batch per time point. (J-K’) Immunostaining for SATB2 (yellow) in day74 WNTi and WNTi + FGF8 organoids, as indicated. The left schematic depicts the in vivo distribution of SATB2+ neurons, and Figure 4—figure supplement 2 quantifies SATB2+ neuron density in these and additional samples. (L-M’) Immunostaining for ASCL1 (red) in day69 WNTi and WNTi + FGF8 organoids, as indicated. Left schematic shows the in vivo distribution of ASCL1+ ventral progenitors, with cell density detailed in Figure 4—figure supplement 2. Scale bars: 100 µm. Ctx, cortex; MGE, medial ganglionic eminence; LGE, lateral ganglionic eminence.

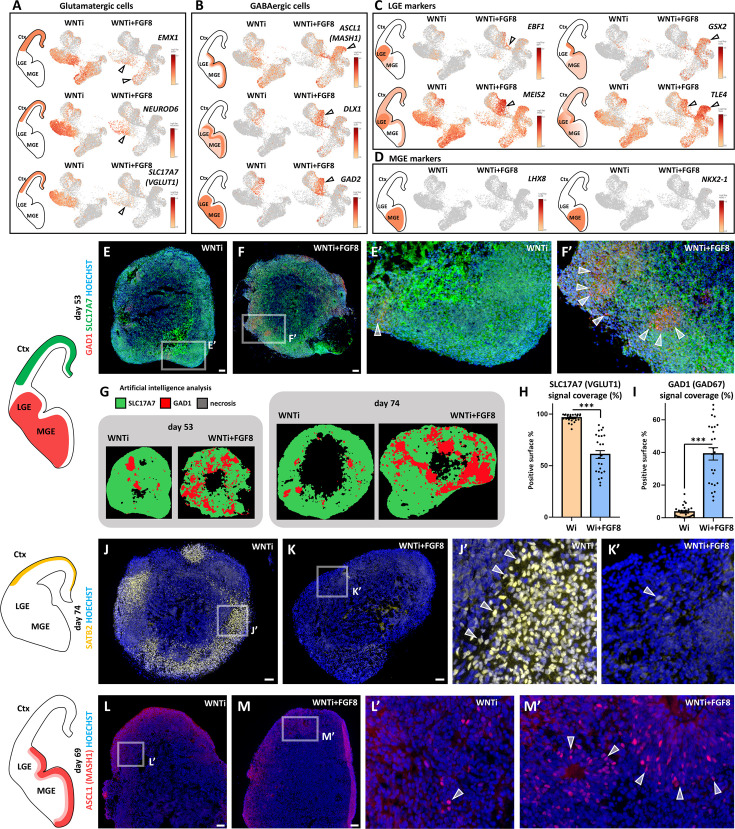
Figure 4—source data 1. SLC17A7 (VGLUT1)-positive area in human organoids.
GraphPad sheet with SLC17A7-positive area data in WNTi and WNTi + FGF8 organoids.
Figure 4—source data 2. GAD1 (GAD67)-positive area in human organoids.
GraphPad sheet with GAD1-positive area data in WNTi and WNTi + FGF8 organoids.

Figure 4.

Figure 4—figure supplement 1. Changes in cellular composition and glutamatergic/GABAergic identity upon FGF8 treatment.

Figure 4—figure supplement 1.

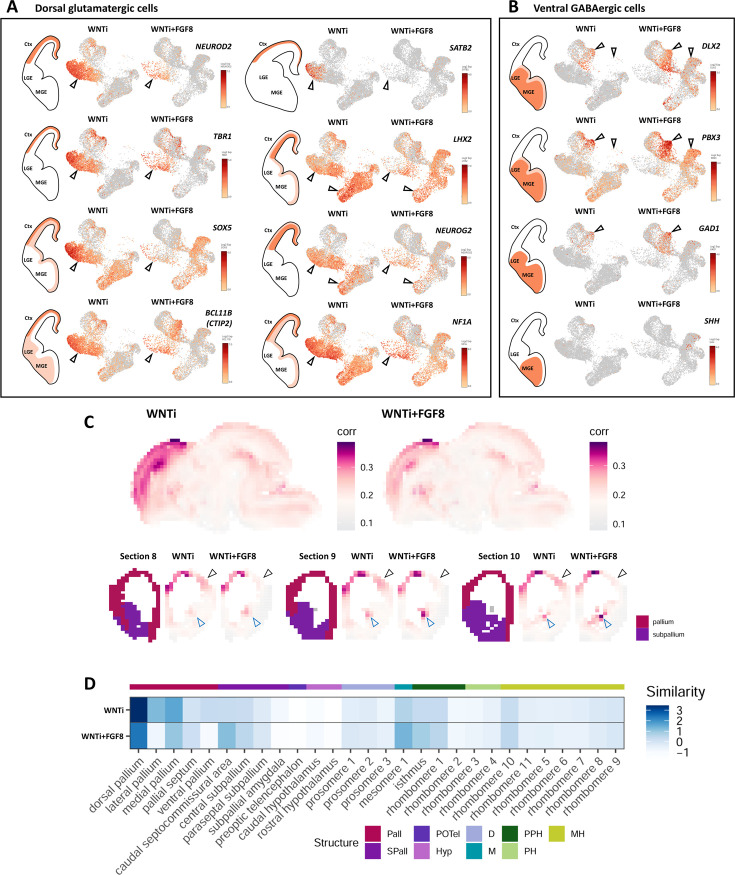
(A,B) Expression level of known markers identifying dorsal glutamatergic NPs and neurons (panel A; NEUROD2, TBR1, SOX5, BCL11B -also called CTIP2-, SATB2, LHX2, NEUROG2 and NF1A) or ventral GABAergic NPs and neurons (panel B; DLX2, PBX3, SHH and GAD1). FGF8 treatment causes an increase of ventral GABAergic cells at the expense of dorsal glutamatergic ones. Empty arrowheads indicate clusters showing the greatest differences in cell and marker abundance following FGF8 treatment. (C) VoxHunt similarity map showing correlation index (white to violet color code) of WNTi (left) or WNTi + FGF8 (right) organoids to reference databases of mouse regional brain atlases. For this analysis, all WNTi cells and all WNTi + FGF8 cells are evaluated. FGF8-treated organoids show lower similarity to dorso-lateral pallium (black arrowheads) and increased similarity to subpallial domains (blue arrowheads), compared to control samples. (D) VoxHunt heatmap illustrating the similarity score (blue color code) among the expression profile of organoid samples (WNTi -upper line- and WNTi + FGF8 -lower line-) and distinct mouse brain regions (columns). FGF8-treated organoids show lower similarity to dorsal pallium and increased similarity to subpallial regions, compared to control samples. Pall: pallium; Spall: Subpallium; POTel: Preoptic telencephalon; Hyp: hypothalamus; D: diencephalon; M: mesencephalon; PPH: Prepontine hindbrain; PH: Pontine hindbrain; MH: Medullary hindbrain.
Figure 4—figure supplement 1—source data 1. VoxHunt analysis report.
Detailed report on VoxHunt visualization methods and data.
Figure 4—figure supplement 2. Immunostaining analysis of glutamatergic and GABAergic cellular composition of control and FGF8-treated telencephalic organoids.

Figure 4—figure supplement 2.

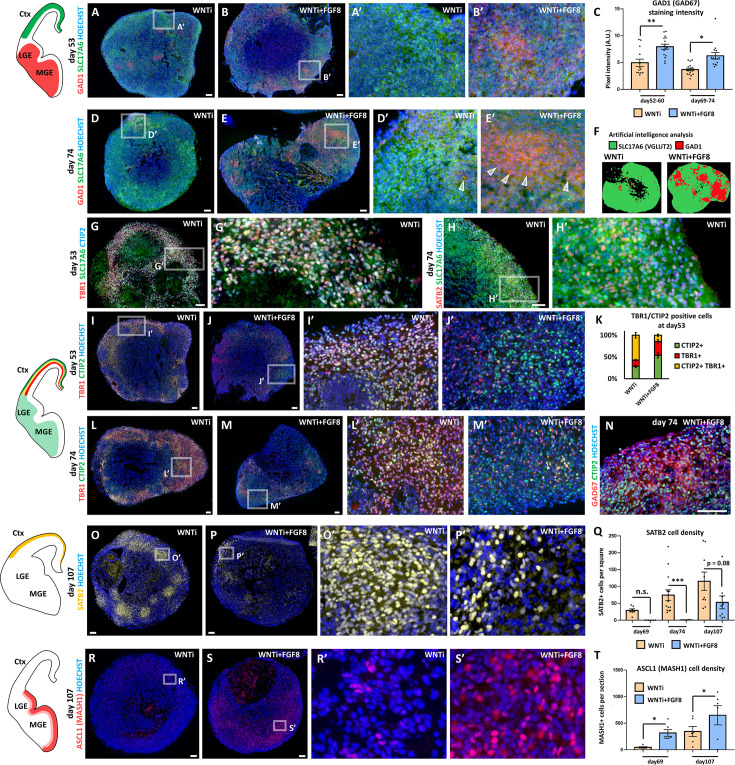
(A–F) GAD1 (also called GAD67; red) and SLC17A6 (also called VGLUT2; green) immunostaining in day53 and in day74 control (WNTi) and treated (WNTi + FGF8) organoids, as indicated. The distribution of these markers in vivo is illustrated in the brain scheme on the left. Graph in C displays GAD1 pixel intensity quantification at day52-60 and at day69-74, while F shows exemplificative images of automatically detected SLC17A6 (green) and GAD1 (red) marker distribution in day74 organoids (HALO software). n≥13 sections from n≥4 organoids from n=2 batches. (G-H’) Co-staining of SLC17A6 (green) with TBR1 and CTIP2 (red and blue in G,G’) and SATB2 (red in H,H’), highlighting co-expression of SLC17A6 with neocortical markers. (I-M’) TBR1 (red) and CTIP2 (green) immunostaining in day53 (I–J) or day74 (L-M’) control (WNTi) and treated (WNTi + FGF8) organoids, as indicated. The distribution of these markers in vivo is depicted in the brain schemes on the left. Note that TBR1 and CTIP2 can be co-expressed dorsally (in cortical layers) during development; TBR1 is exclusively dorsal, whereas CTIP2 is also expressed in the ventral telencephalon. Graph in K shows the percentage of TBR1+ (red), CTIP2+ (green) or double TBR1+/CTIP2+ (yellow) cells in WNTi or WNTi + FGF8 organoids at different steps (day53 in H and day74 in I), as indicated. (N) GAD67 (red) and CTIP2 (green) immunostaining in day74 WNTi + FGF8 organoids with double CTIP2+ GAD67+ cells. (O–Q) SATB2 (yellow) immunostaining in day107 control (WNTi) and treated (WNTi + FGF8) organoids, as indicated. The distribution of SATB2+ neurons in vivo is illustrated in the brain scheme on the left, while graph in Q displays cell density at day69, day74 or day107. SATB2 cell density was measured as number of SATB2+ cells per 150X150 µm square; n≥4 sections from n≥2 organoids from n=1 batch per time point/condition. (R–T) ASCL1 (also known as MASH1; red) immunostaining in day107 control (WNTi) and treated (WNTi + FGF8) organoids, as indicated. Quantification of the cell density (number of cells per organoid section) of ASCL1+ progenitors at day69 or day107 is shown in the graph in T; n≥5 sections from n≥2 organoids from n=1 batch per time point/condition. Scale bars: 100 µm.
Figure 4—figure supplement 2—source data 1. GAD1 (GAD67) pixel intensity in human organoids.
GraphPad sheet with raw pixel intensity data measured in WNTi and WNTi + FGF8 organoid cryostat slices following GAD1 immunostaining.
Figure 4—figure supplement 2—source data 2. TBR1 and CTIP2 co-expression in human organoids.
Excel summary datasheet showing TBR1 and CTIP2 cell percentages in WNTi and WNTi + FGF8 organoids.
Figure 4—figure supplement 2—source data 3. SATB2 cell abundance in human organoids.
GraphPad sheet with numbers of SATB2+ cells in WNTi and WNTi + FGF8 organoid cryostat slices.
Figure 4—figure supplement 2—source data 4. ASCL1 (MASH1) cell abundance in human organoids.
GraphPad sheet with ASCL1+ cell counts in WNTi and WNTi + FGF8 organoid cryostat slices.
Figure 4—figure supplement 3. Regional identity-dependent effect of FGF8 treatment on D/V identity and target gene modulation.

Figure 4—figure supplement 3.

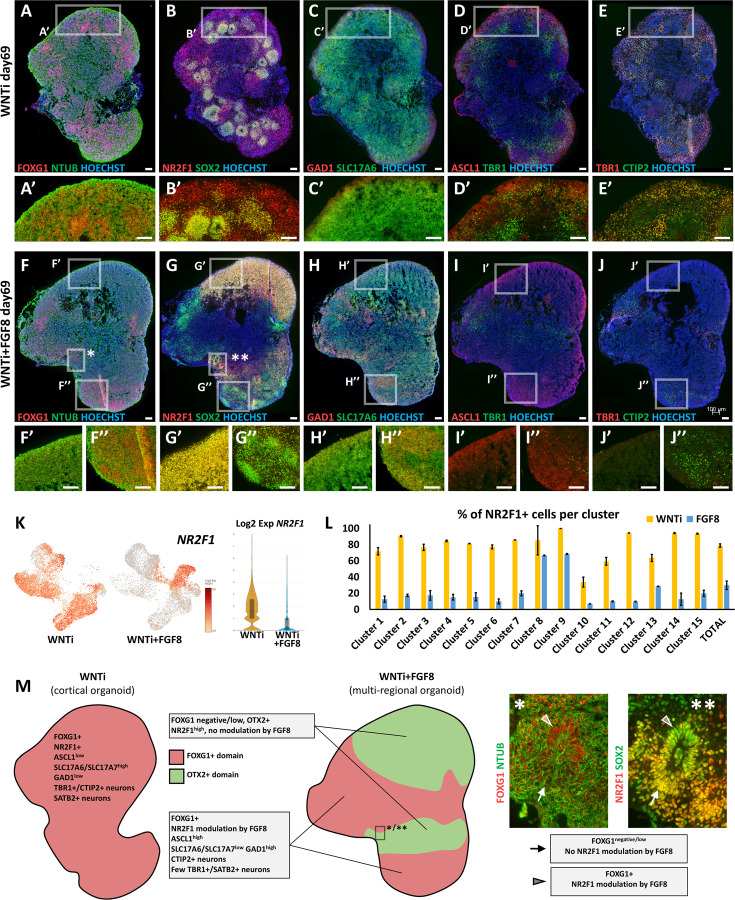
(A-E’) Immunostaining of key neural and regional markers on day69 WNTi control organoids; FOXG1 (red in A,A’), NR2F1 (red in B,B’) and SOX2+ NPs (green in B,B’). Glutamatergic/cortical markers SLC17A6 (also called VGLUT2; green in C,C’), TBR1 (green in D,D’ or red in E,E’) and CTIP2 (green in E,E’) are abundant, indicating neocortical identity. (F-J’’) Immunostaining of the same key neural and regional markers showed in A-E’, but on sections of day69 WNTi + FGF8 treated organoids. Insets represent magnification from a FOXG1-negative non-telencephalic region (F’, G’, H’, I’, J’) or from a FOXG1+ telencephalic region (F’’, G’’, H’’, I’’, J’’). NR2F1 (red in G-G’’) show high intensity, i.e. no response to FGF8 treatment, in FOXG1-negative non-telencephalic areas. Only FOXG1+ telencephalic domains exhibit FGF8-mediated reduction of NR2F1 levels (G, G’’), associated with induction of ventral markers GAD1 (red in H,H’’) and ASCL1 (red in I,I’’) at the expense of dorsal cortical markers TBR1 (green in I-I’’). No dorsal cortical markers such as TBR1 and CTIP2 are detectable in FOXG1-negative regions (I’, J’), illustrating that efficient acquisition of anterior identity is necessary for production of cortical neurons in organoids. Insets indicated by asterisks in F (*) and G (**) are showed at high magnification in M. Scale bars: 100 µm. (K,L) Expression level and percentages of positive cells per cluster for NR2F1 in control (WNTi) and treated (WNTi + FGF8) organoids, as indicated. NR2F1 transcript levels are greatly reduced by FGF8 (K); however, clusters 8 and 9 fail to respond to FGF8 treatment by downregulating NR2F1 (L) and still contain >60% NR2F1+ cells. (M) Schematic representation of distinct domains in control (WNTi; left) and FGF8-treated (WNTi + FGF8; right) organoids. FOXG1+ telencephalic WNTi organoids (left) have high levels of the glutamatergic marker SLC17A6 and abundant SATB2+ and TBR1/CTIP2 double positive cortical neurons. Upon FGF8 treatment, WNTi + FGF8 organoids (right) develop co-existing FOXG1+ telencephalic domains (light red areas), in which ventral GABAergic markers GAD1 and ASCL1 are upregulated at the expense of dorsal genes, and FOXG1-/OTX2+ diencephalic/midbrain domains (light green areas). Immunostaining magnifications on the right (magnification * and ** from images in F and G, respectively) show a neural rosette located at the border between a FOXG1+ domain (upper half of the rosette; arrowheads) and an adjacent FOXG1- low expressing domain (lower half; arrows). This highlights that NR2F1 is down-regulated by FGF8 only in the telencephalic SOX2+ domain (upper half of the rosette), indicating that FGF8 target genes can respond in a different way depending on the regional identity of organoid domains. Scale bars: 100 µm.
Figure 4—figure supplement 3—source data 1. Percentage of NR2F1+ cells per cluster in WNTi and WNTi + FGF8 organoids.
Summary Excel datasheet showing NR2F1-positive cell counts per cluster for WNTi and WNTi + FGF8 samples, extracted via 10 X Genomics Loupe Browser.