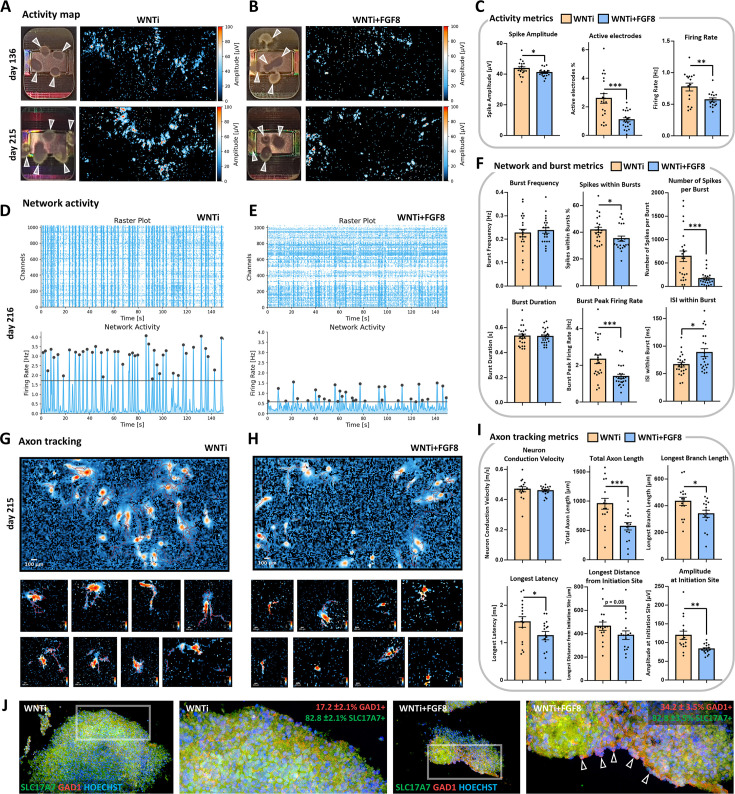
Figure 5. Electrophysiological spontaneous activity of control and FGF8-treated 3D organoid networks.
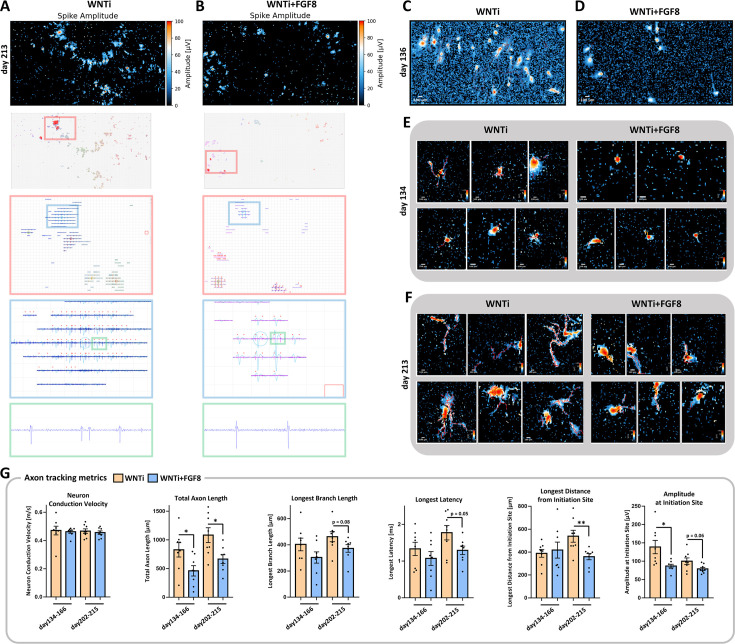
(A–C) Spontaneous activity maps showing mean spike amplitude in 4-month-old (day136; upper row) and 7-month-old (day215; lower row) control (WNTi; A) and treated organoids (WNTi + FGF8; B), 2–3 weeks post-plating on high-density MEA chips. Mean activity metrics from three independent batches are summarized in (C), showing a general reduction in spike amplitude, percentage of active electrodes, and firing rate in FGF8-treated organoids. White arrowheads in electrode images indicate organoids fully or partially adhered to the MEA recording surface; note that high activity levels are observed at the organoid edges, where axonal tracts extend. (D–F) Temporal raster plots displaying firing events recorded by the 1024 most active electrodes (upper graphs) and their synchronicity indicative of network activity (lower graphs) in 7-month-old controls (WNTi; D) and FGF8-treated organoids (WNTi + FGF8; E), 3 weeks post-plating. Note that the instrument automatically sets the detection threshold (black bar) at varying levels, based on the average baseline activity specific to each sample (see Materials and methods). Graphs in (F) show network metrics (Burst frequency; Spikes within bursts) and burst metrics (number of spike per burst, burst peak firing rate, burst duration, inter-spike interval within bursts). (G–I) Overview fields of axon tracts (upper row) and representative images of individual neuronal tracts (lower rows) extending from organoids on the MEA surface, as detected using the automatic axon tracking function in WNTi (G) and WNTi + FGF8 (H) samples at day215. Graphs in (I) present axon tracking metrics (network conduction velocity, total axon or branch lengths, longest signal latency, maximum distance from initiation site, and signal amplitude), showing reduced signal amplitude and spatial propagation in FGF8-treated organoids. Additional axon tract images at different stages of differentiation are provided in Figure 5—figure supplement 1. (J) Immunostaining for GAD1 (red) and SLC17A6 (green) in day 145 control (WNTi) and treated (WNTi + FGF8) organoids, following detachment from MEA chips post-recording. Percentages of GAD1- and SLC17A7-positive tissue in organoids are indicated. For all graphs: data represent n=3 distinct batches (each with 2–4 organoids on the MEA chip, see Materials and methods).


