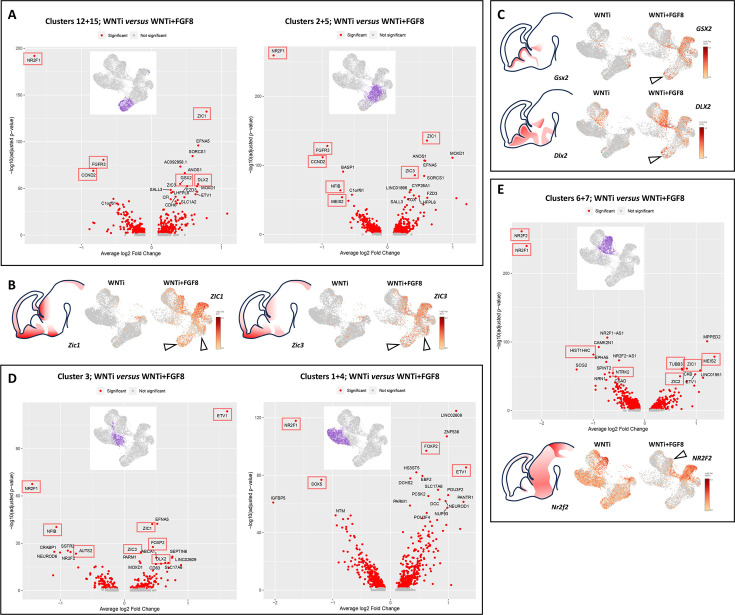
Figure 6. Analysis of differentially expressed genes (DEGs) in glutamatergic and GABAergic progenitors and neurons upon FGF8 treatment.
(A) DEG analysis comparing control (WNTi) and treated (WNTi + FGF8) organoids, highlighting the most strongly (x-axis, average log2 fold change) and most significantly (y-axis, adjusted p-value in -log10) differentially expressed genes (DEGs) in clusters 12/15 (proliferating glutamatergic progenitors; left volcano plot) or clusters 2/5 (non-proliferating glutamatergic progenitors; right volcano plot). Red dots indicate significantly (adjusted P-value <0.05) regulated genes, with the names of the 20 most significant ones displayed (see source data material for a complete list of DEGs). (B) Expression level of ZIC1 (left) and ZIC3 (right) in UMAP projections of WNTi and WNTi + FGF8 samples, as indicated. Black arrowheads point to increased ZIC1 and ZIC3 expression in glutamatergic progenitor clusters following FGF8 treatment. (C) Expression level of GSX2 (upper panel) and DLX2 (lower panel) in UMAP projections of WNTi or WNTi + FGF8 samples, as indicated. Black arrowheads indicate increased GSX2 and DLX2 expression in proliferating glutamatergic progenitors upon FGF8 treatment. (D) DEG analysis comparing control (WNTi) and treated (WNTi + FGF8) organoids, highlighting the most significantly regulated genes in cluster 3 (early differentiating glutamatergic neurons; left volcano plot) or clusters 1/4 (differentiated glutamatergic neurons; right volcano plot). (E) DEG analysis comparing control (WNTi) and treated (WNTi + FGF8) organoids, showing the most significantly regulated genes in clusters 6/7 (volcano plot), corresponding to GABAergic neurons. The panel below shows the expression level of NR2F2 in UMAP projections of WNTi and WNTi + FGF8 samples, as indicated. The black arrowhead points to decreased NR2F2 expression in GABAergic cells following FGF8 treatment. Red boxes highlight FGF target genes or genes noted in OMIM as disease-related. Brain schematics with gene expression patterns are based on embryonic day 13.5 stainings from the Mouse Allen Brain Atlas.


