. 2024 Nov 1;13:e98096. doi: 10.7554/eLife.98096

Figure 7. FGF8-dependent acquisition of distinct antero-posterior areal identities in human telencephalic organoids.

(A) Glutamatergic neural progenitor (NPs; clusters 2/5/12/14/15) and glutamatergic neurons (clusters 1/3/4) are highlighted on the UMAP projection of day69 organoid scRNAseq data. (B,C) Images on the right display the clusters selected for analysis, as described in A. The graphs show the percentages of cells expressing anterior-posterior (A/P) cortical markers within the two highlighted cluster groups: NPs (top graph) and neurons (bottom graph). The percentage of cells positive for anterior markers (PAX6, ER81, ETV5) and posterior markers (WNT7B, EMX2, NR2F1, FGFR3, CRYM, TSHZ2, ODZ3) is shown in yellow for control (WNTi) organoids and in blue for FGF8-treated (WNTi + FGF8) organoids. (D) Expression level of key posterior (NR2F1, FGFR3, WNT7B, EMX2) and anterior (ETV1, PAX6) genes in UMAP projections of WNTi or WNTi + FGF8 day69 organoid samples, as indicated. Black arrowheads in the NR2F1 and FGFR3 UMAP projections point to decreased expression in proliferating glutamatergic progenitors upon FGF8 treatment, while arrowheads in the ETV1 UMAP projection indicate increased expression in FGF8-treated glutamatergic neurons. Brain schematics with gene expression patterns are based on embryonic day 13.5 staining data from the Mouse Allen Brain Atlas.

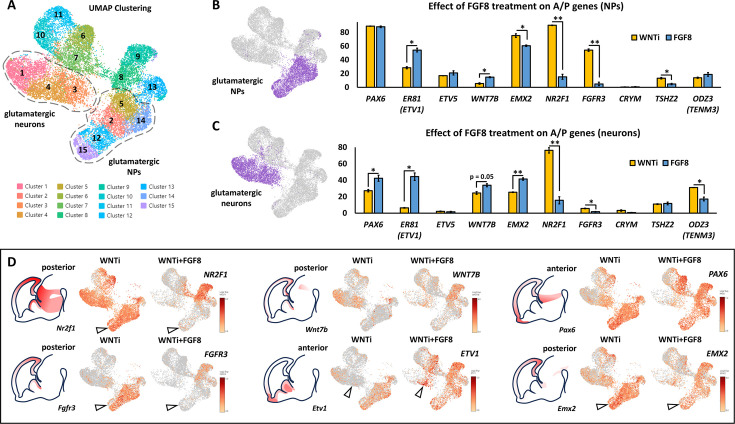
Figure 7—source data 1. Percentage of cells expressing antero-posterior cortical markers in WNTi and WNTi + FGF8 organoids.
Summary Excel datasheet with counts of cells expressing A/P markers (PAX6, ER81, ETV5, WNT7B, EMX2, NR2F1, FGFR3, CRYM, TSHZ2, and ODZ3) within glutamatergic progenitor (clusters 2, 5, 12, 14, 15) and neuron (clusters 1, 3, 4) groups for both WNTi and WNTi + FGF8 samples, extracted via 10 X Genomics Loupe Browser.

Figure 7.

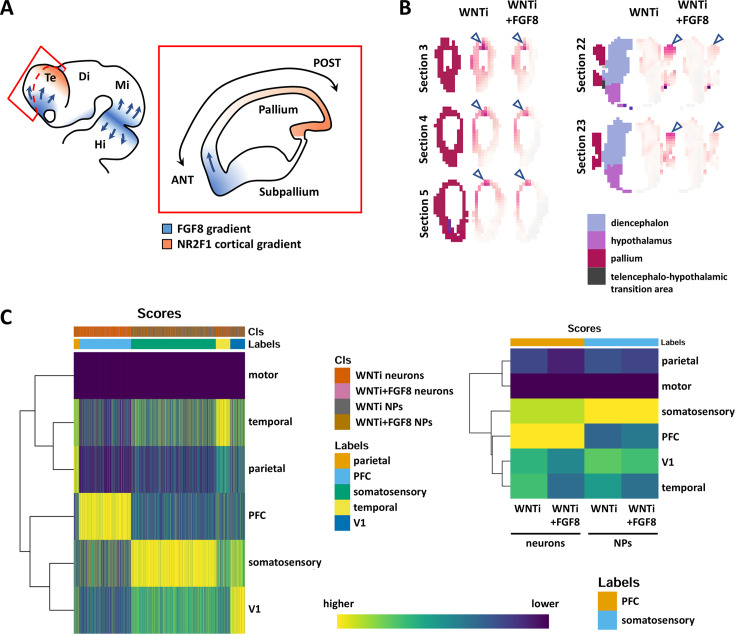
Figure 7—figure supplement 1. FGF8-dependent acquisition of different antero-posterior areal identities in human telencephalic organoids.

Figure 7—figure supplement 1.

(A) Schematic drawing of the mammalian developing brain showing FGF8 sources (blue) in the anterior telencephalon and at the midbrain/hindbrain border, and their presumable diffusing gradients (arrows). The red inset illustrates a sagittal section of the telencephalon with the two opposite FGF8 (blue) and NR2F1 (orange) gradients. (B) VoxHunt Similarity Map showing similarity correlation index (white to violet color code) of control (WNTi) and treated (WNTi + FGF8) organoids on virtual brain coronal sections. The color code in the first left column of brain virtual sections identifies different brain regions, listed in the legend at the bottom. Blue arrowheads point to the dorsal-most region of the pallium. (C) Cell-level (left) and cluster-level (right) heatmaps of the SingleR assignment scores (i.e. the confidence of the predicted labels across the dataset; dark blue to yellow color code) as well as the corresponding inferred annotation for the clusters/cells in the ‘Labels’ top bar. Cell/cluster annotation was obtained by using SingleR to evaluate the similarity between control (WNTi) or FGF8-treated (WNTi + FGF8) samples against a 16 post conceptional week (PCW) fetal brain dataset. Glutamatergic progenitors correspond to clusters 2/5/12/14/15, while neurons corresponded to clusters 1/3/4. The reference dataset corresponds to primary cells dataset published by Speir et al., 2021 and where only cells belonging to 16 PCW and not to the hippocampus were kept. In the left graph, the ‘Cls’ top bar identifies the organoid cells. Note that most of the organoid cells (columns) are annotated as pre-fontal cortex (PFC; light blue) or somatosensory cortex (green), based on transcriptional similarity. In the graph on the right, the average annotation score per sample is depicted; control and treated progenitors show high annotation score to somatosensory cortex, while control and treated neurons resemble the PFC. Despite this, note that FGF8 treatment decreases the annotation score to caudal V1 (visual) and temporal areas, while slightly increasing the annotation score to the rostral PFC, indicating anteriorization of cell identity.
Figure 7—figure supplement 1—source data 1. SingleR cluster annotation analysis of human organoid areal identity.
Detailed report on methods and data for annotating clusters/cells using SingleR, comparing in vitro organoids with in vivo fetal cortical regions, specifically assessing glutamatergic neuron (clusters 1, 3, 4) and progenitor (clusters 2, 5, 12, 14, 15) clusters.