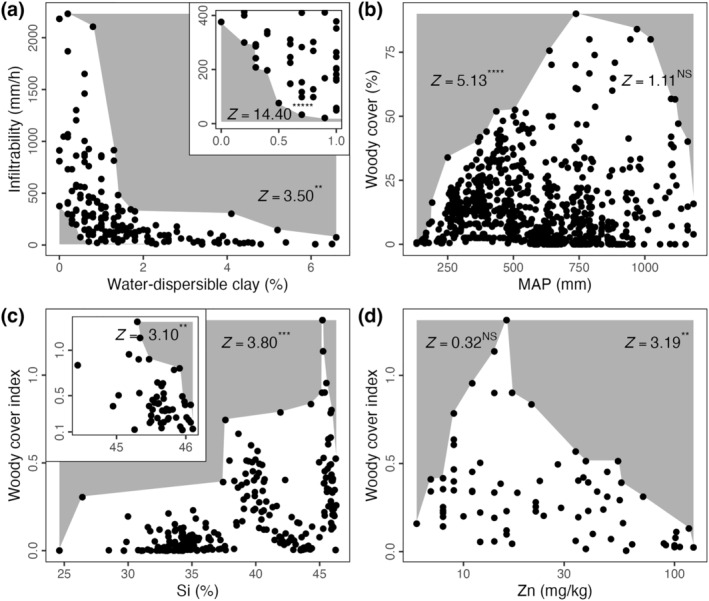
FIGURE 3.

Application of our proposed boundary line permutation test to empirical datasets. (a) Infiltrability versus water‐dispersible clay content of soils across Namibia and western South Africa (Mills et al. 2006), with the lower‐left no‐data zone highlighted in the inset. (b) Woody cover versus mean annual precipitation (MAP) in African woody savannas (Sankaran et al. 2005), (c, d) Woody cover index versus (c) silicon (Si) and (d) zinc (Zn) content of soils across Namibia and western South Africa (Mills et al. 2013). In (c), the upper‐right no‐data zone highlighted in the inset depicts only points from true woodland savanna sites (i.e., excluding desert, Succulent Karoo, Nama Karoo and thornbush savanna sites); the Z‐value for this no‐data zone results from a permutation test of only those data. All tests were based on 10,000 permutations of their respective data. Asterisks denote significances (p ≤ 1 × 10⁻¹⁰, *****; p ≤ 1 × 10⁻⁶, ****; p ≤ 1 × 10⁻⁴, ***; p ≤ 0.001, **; p ≤ 0.005, *; p > 0.05, not significant—NS) following one‐sided Z‐tests of each observed boundary line against 10,000 permutations.
