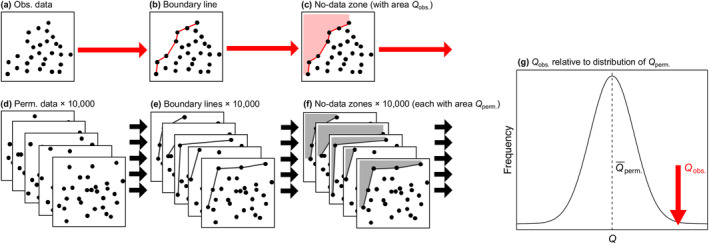
FIGURE 4.

The logic of the permutation test for a boundary line for the upper‐right no‐data zone, illustrating how the areal extents of the (a–c) observed no‐data zone (Q obs.) and (d–f) 10,000 permuted no‐data zones (each Q perm.) are compared in (g) a Z‐test.
