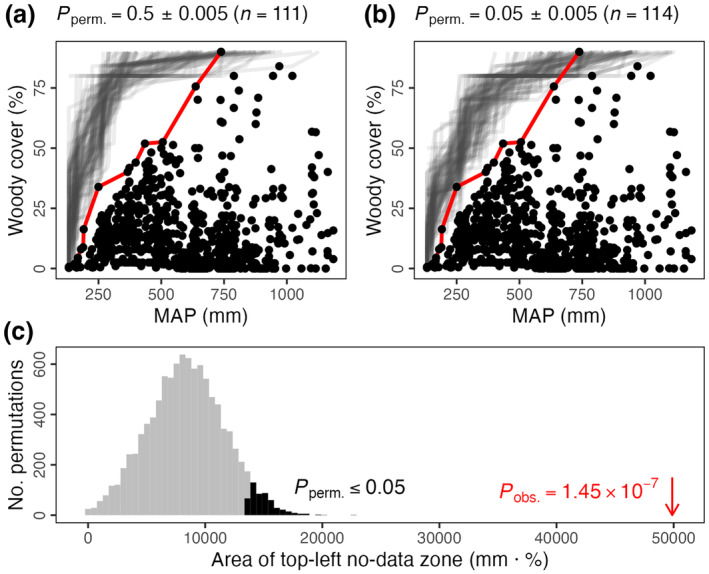
FIGURE 5.

The logic of the permutation test for a boundary line using empirical data (as in Figure 3b; Sankaran et al. 2005), testing the upper‐left no‐data zone. Boundary lines were defined for each of the 10,000 permutations of the data (as in Figure 4d–f). Relative to these, the significance of the area bounded by the observed boundary line (in red, as in Figure 4a–c) is assessed using a one‐sided Z‐test (c). Each permutation's boundary line can also be subjected to a Z‐test relative to the other 9999 lines. Subsets of these permuted boundary lines are presented in translucent grey in (a) and (b) (numbering 111 and 114, respectively) according to their p‐values: (a) those close to 0.5 (i.e., examples that are not significant) and (b) close to 0.05 (visualising where significant lines typically fall), respectively.
