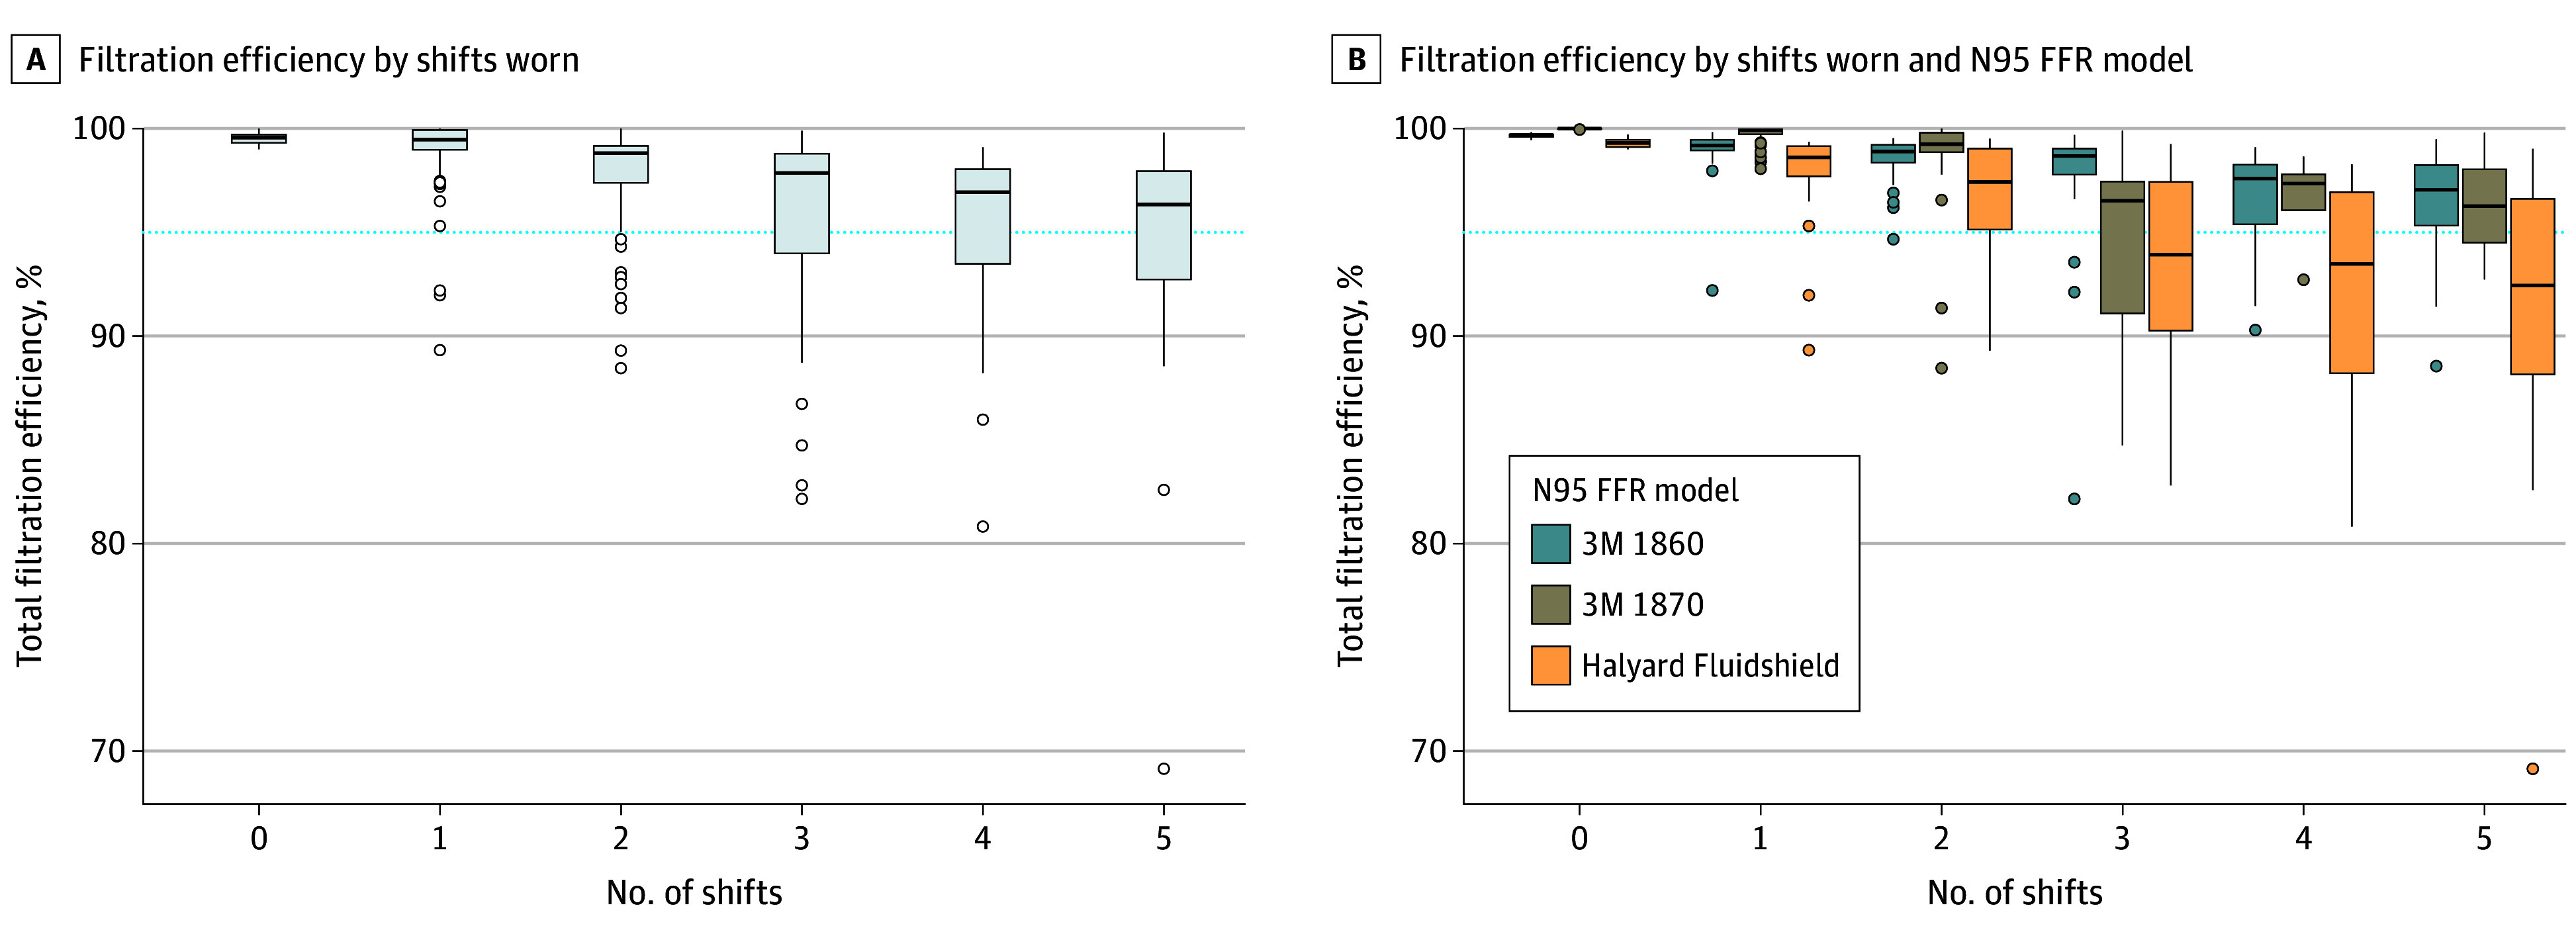
Figure. Boxplot of Percentage Filtration Efficiency by Shifts Worn and by N95s Model.

The dotted line indicates 95% filtration efficiency; circles, outliers, edges of boxes, upper and lower quartiles; center line in boxes, median value; whiskers, the minimum and maximum values.
