
Figure 1. Integrated Sleep Probability Timelines.
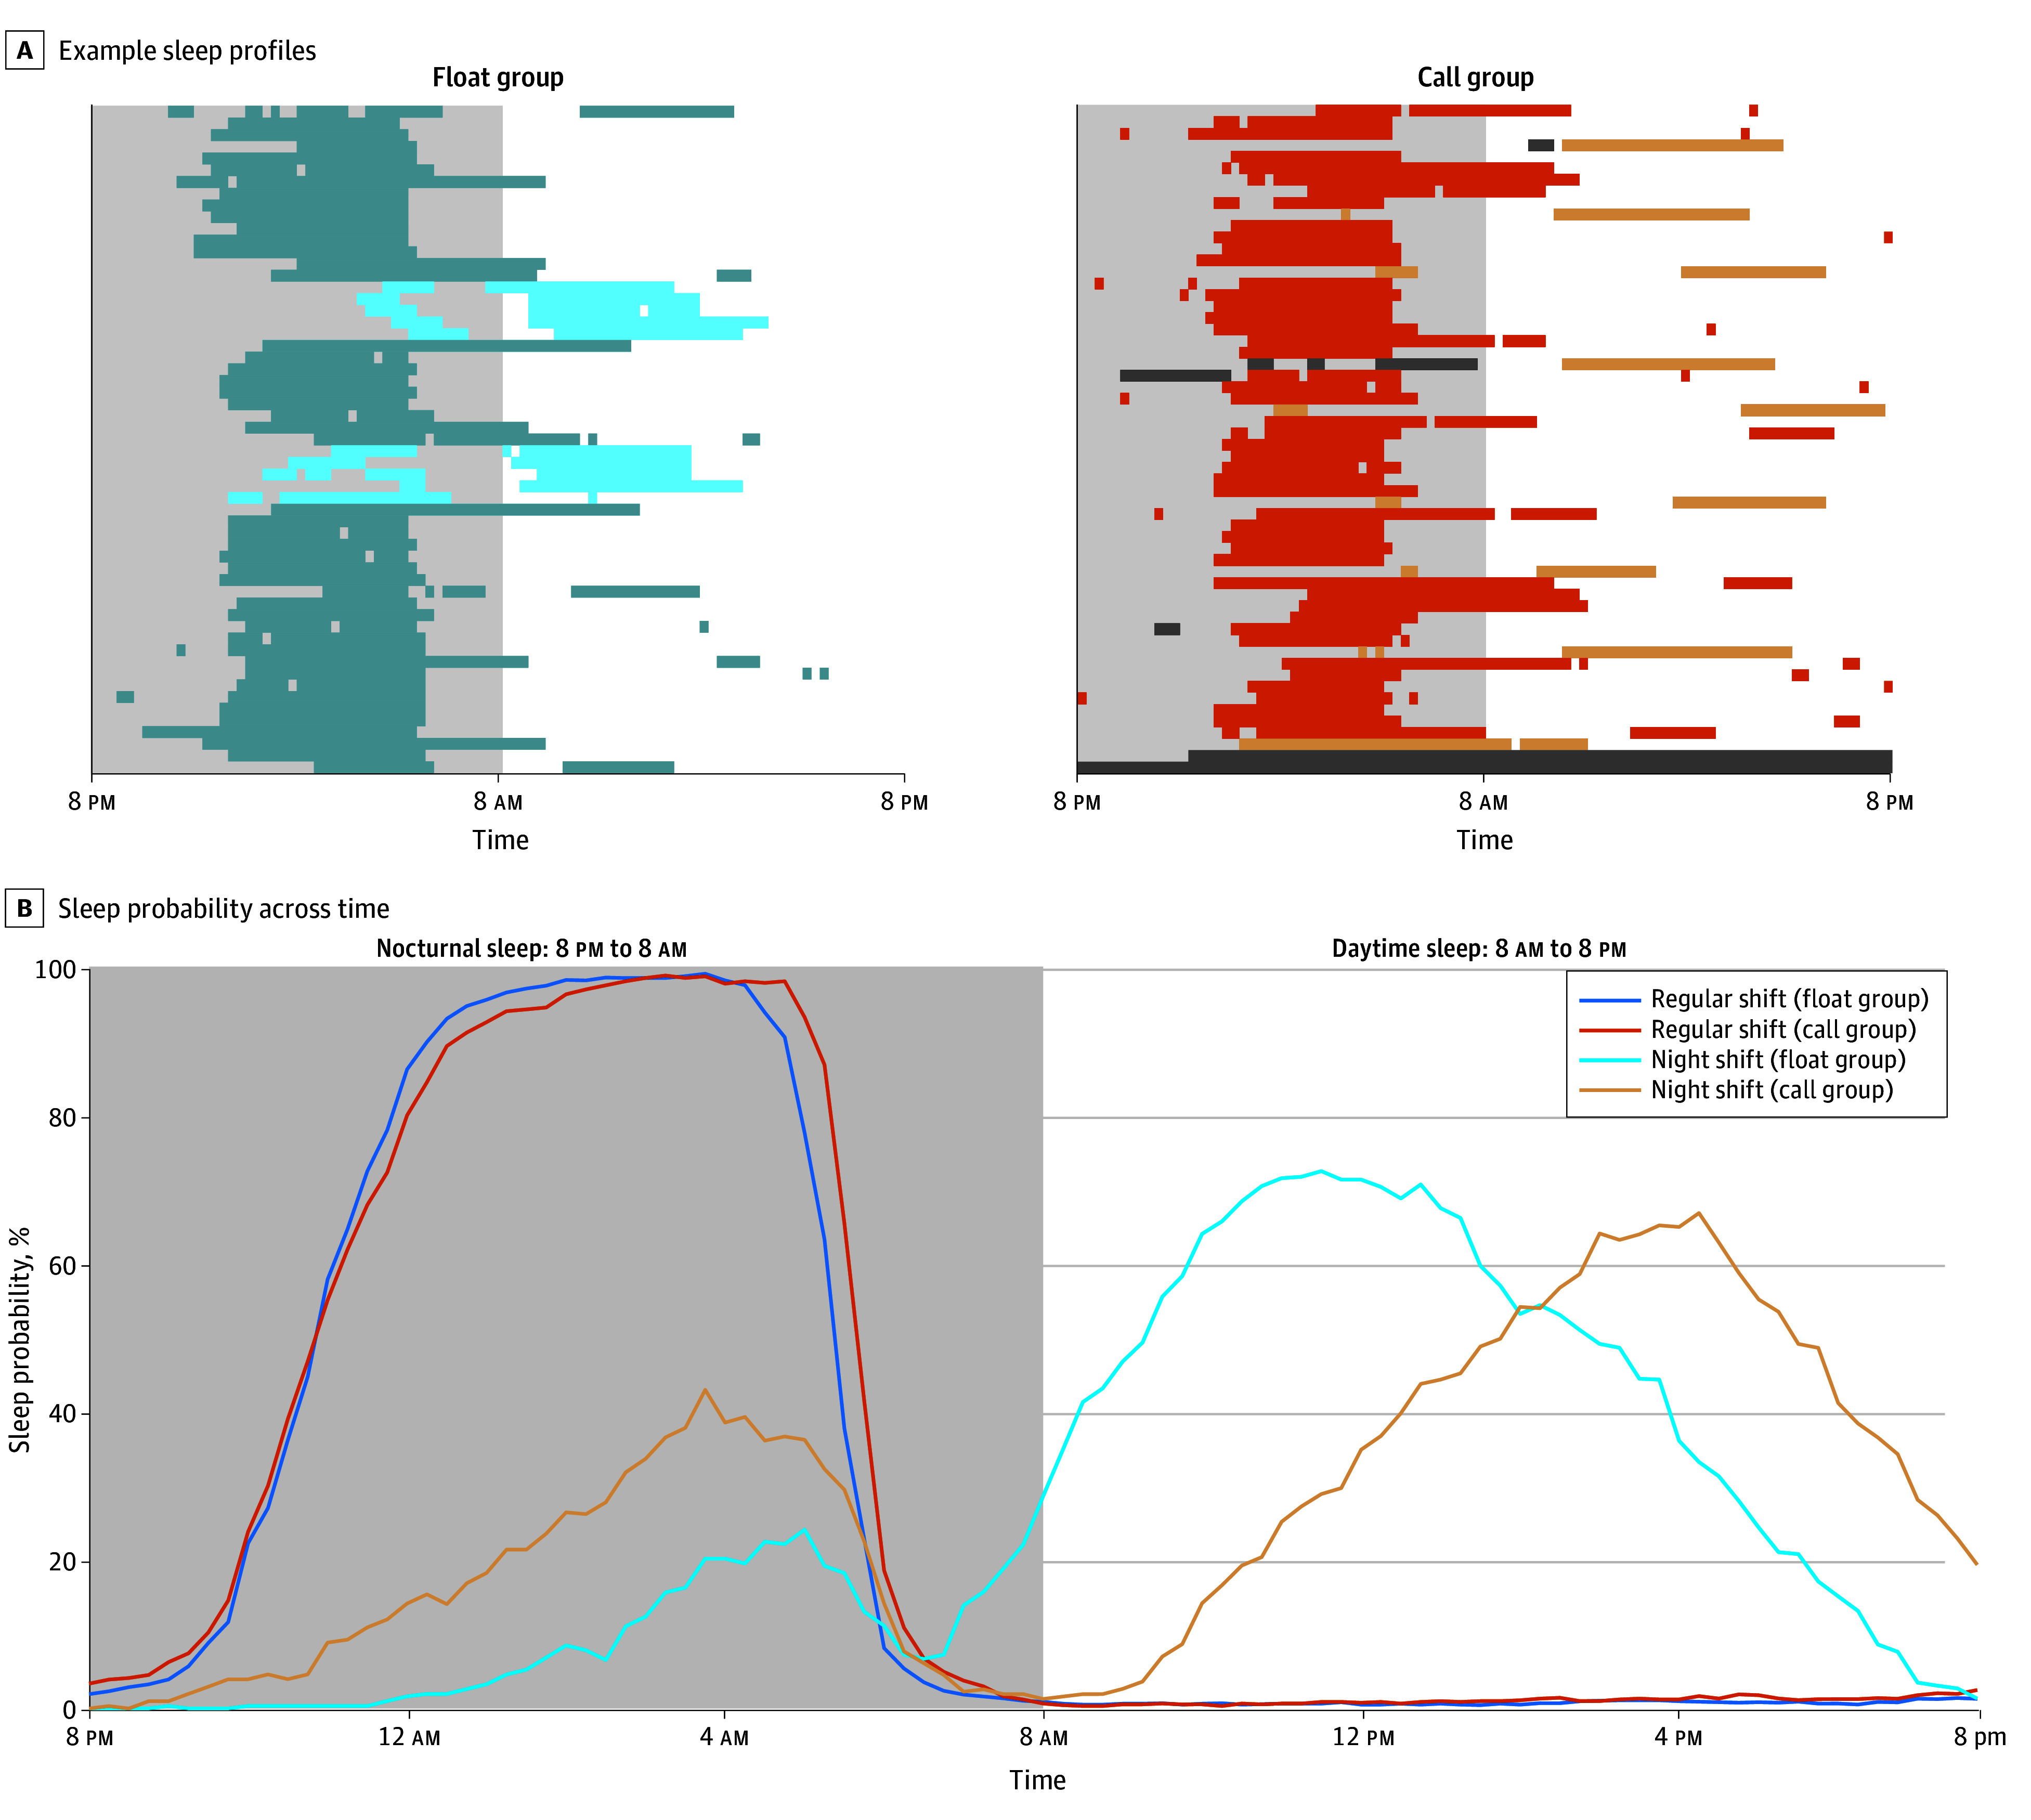
A, Example sleep patterns from a float (blue) and a call participant (orange), with darker shades indicating sleep on regular shift days and lighter shades indicating sleep on night-shift days. B, Mean sleep probability over time for regular and night-shift days. Dark gray shaded areas indicate missing data. Light gray areas indicate nocturnal sleep periods, and white areas indicate daytime sleep periods.