FIGURE 5.

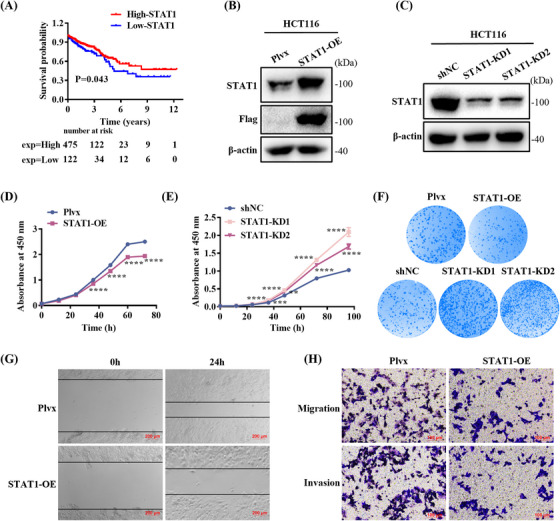
Signal transducer and activator of transcription 1 (STAT1) overexpression inhibits cell proliferation and migration. (A) Kaplan–Meier overall survival analysis between patients with high (n = 475) and low (n = 122) STAT1 expression. p value was calculated using log‐rank test. (B) STAT1 overexpression verification by Western blot (WB). (C) STAT1 knockdown verification by WB. (D) STAT1 overexpression in HCT116 cells inhibited cell growth. (E) STAT1 knockdown promoted cell proliferation. (F) STAT1 overexpression impairs colony formation ability in HCT116, whereas STAT1 knockdown promotes colony formation. (G) Cell migration was inhibited in HCT116‐STAT1‐OE cells compared with that in the control cells. Scale bar: 200 µM. (H) Transwell assays of cell migration and invasion in STAT1‐overexpressing cells. Scale bar: 100 µM. Means ± SEM, **p < 0.01, ***p < 0.001, ****p < 0.0001; Student's t‐test or one‐way analysis of variance (ANOVA) test.
