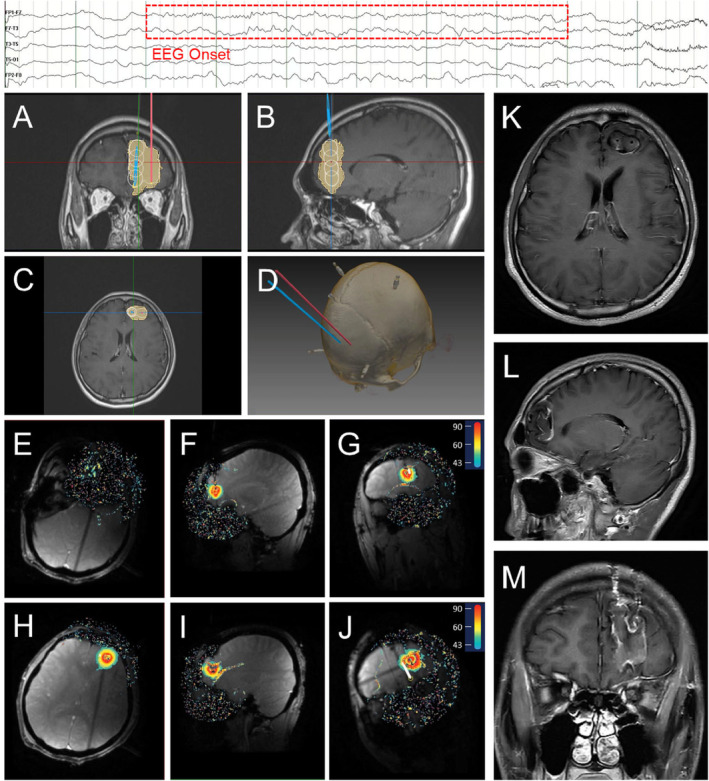
FIGURE 2.

Representative FCD patient's preoperative ablation trajectory planning, intraoperative ablation real‐time thermal monitoring, and postoperative MRI. The top of the figure indicates EEG onset. (A–C) Ablation trajectory planning in coronal, sagittal, and axial plane. (White indicates the planned ablation and yellow indicates the actual ablation); (D) thin‐slice head CT with reconstruction; (E–G) ablation along the first trajectory in axial, sagittal, and coronal plane; (H–J) ablation along the second trajectory in axial, sagittal, and coronal plane; (K–M) postoperative 3‐month MRI in axial, sagittal, and coronal plane.
