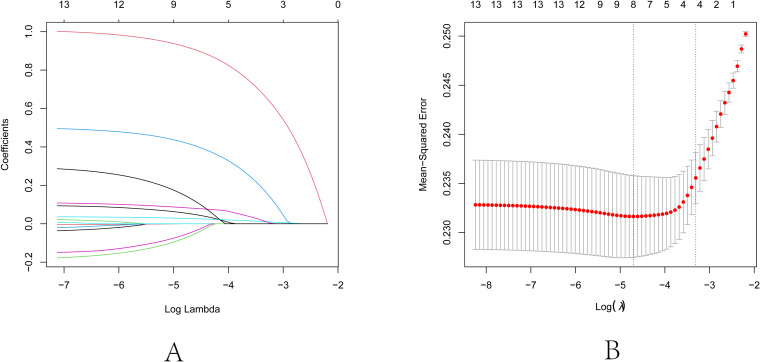
Figure 2.
Lasso regression analysis for feature selection. (A) Lasso coefficient path diagram: The x-axis represents log-lambda, reflecting the degree of regularization. It shows that as the lambda value increases, the coefficient values reduce gradually to zero, and the number of retained variables decreases. (B) Lasso regularization path diagram: The x-axis is log (lambda); the upper axis denotes the number of non-zero coefficients, while the left y-axis represents the Mean-Squared Error (MSE). This graph demonstrates the variation in MSE with different lambda values and the confidence interval of MSE ± one standard deviation. The two vertical lines in the diagram represent the two results selected by the algorithm. The left dashed line is lambda.min, where the lambda value minimizes the MSE, and the right dashed line is lambda.1se, where the lambda value maintains the MSE within one standard error of the minimum MSE, thereby reducing the complexity of the model.

