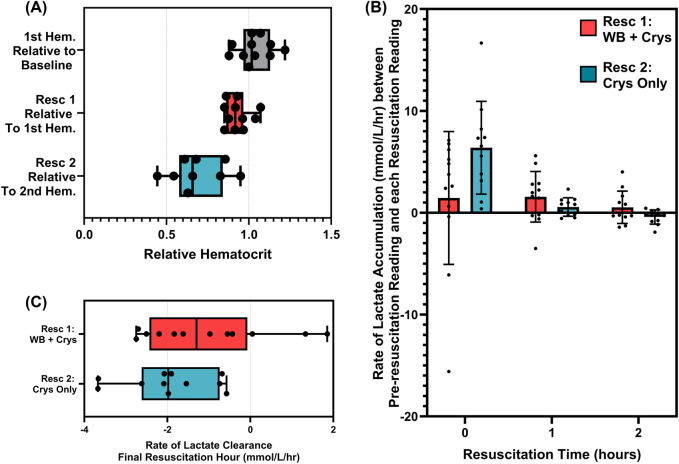
FIGURE 10.
Comparison of hematocrit and lactate clearance trends for the first resuscitation (n = 12) and second resuscitation (n = 11) events. (A) Comparison of changes in hematocrit between baseline and hemorrhage, after the first resuscitation and after the second resuscitation. (B) Rate of lactate clearance based on the slope between the final blood lactate reading prior to resuscitation and after 0-, 1-, and 2-h resuscitation for both resuscitation events. (C) Comparison of the rate of blood lactate clearance during the final 1 h of each resuscitation event.

