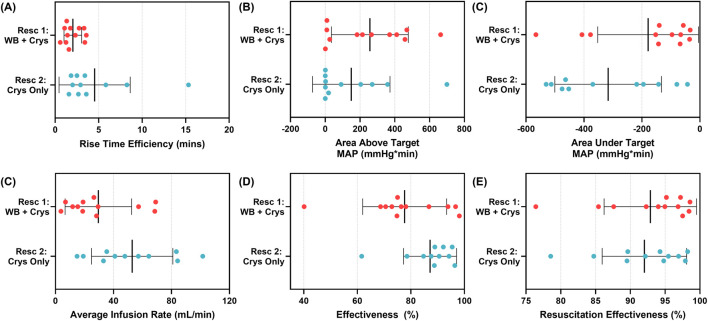
FIGURE 9.
Comparison of selected performance metrics for first resuscitation (whole blood, n = 12) and second resuscitation (crystalloid, n = 11) using the ARC. (A) Rise time efficiency, (B) area above the target MAP and below the MAP response curve, (C) area under the target MAP and above the MAP response curve, (D) average infusion rate, (E) effectiveness, and (F) resuscitation effectiveness are shown as individual data points, with the mean result and standard deviation error bars shown.

