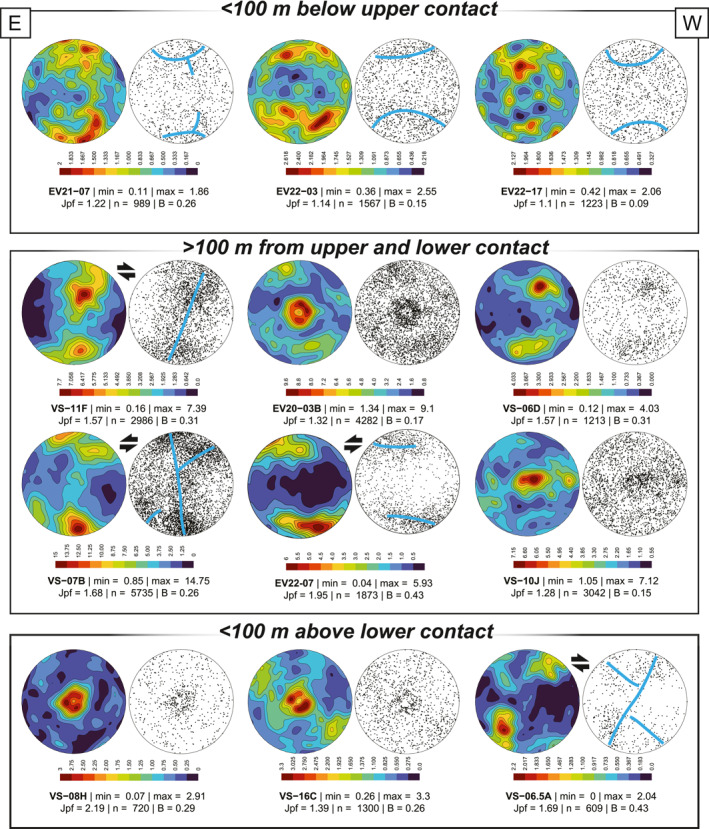
Figure 8.

Lower hemisphere equal area projections showing contour (left) and scatter (right) plots of quartz c‐axis orientations. Shear sense interpretations are included where applicable. All plots are oriented with the foliation (XY) plane perpendicular to the stereoplot and aligned E‐W, and the stretching lineation oriented parallel to the E‐W direction (real orientations range between ENE‐WSW and ESE‐WNW). Samples are grouped according to structural position (see Figure 7).
