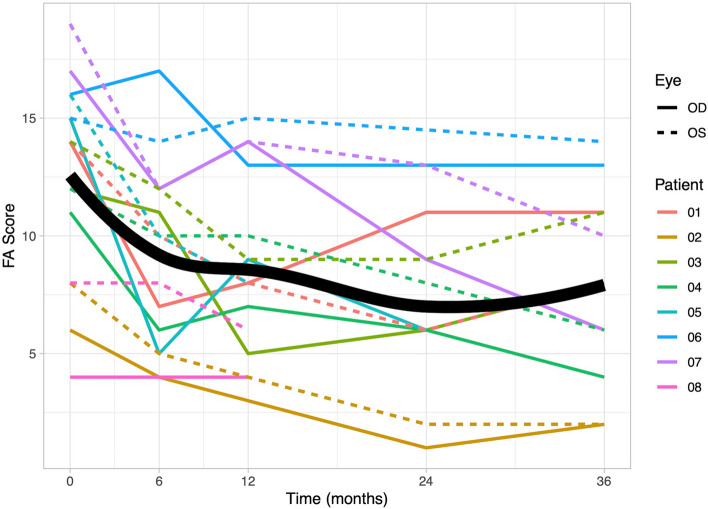
Fig. 4.
Graphical representation of fluorescein angiography (FA) scores. Individual patient data for FA scores are depicted over a 36-month observation period. At baseline, the recorded median FA score was 14 (quartiles: 10.25, 15.25), and it significantly decreased to 10 (5.75, 12) at 6-month. The FA score showed a diminished effect throughout the observation period. The scores for the right eyes are represented by solid lines, while the scores for the left eyes are represented by dashed lines. The bold line on the graph indicates the mean value of the scores, providing an overview of the central trend of the data over time

