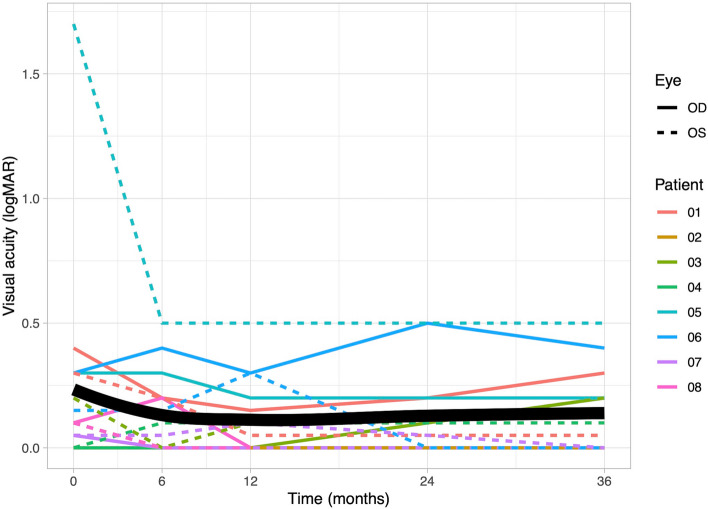
Fig. 7.
The figure presents the changes in Visual acuity (VA) measured in logarithm of minimum angle of resolution [logMAR] for individual patients over a 36-month observation period. VA exhibited slight improvement during the therapy (p = 0.31). The maximum improvement in VA was noted after 12 months of therapy. The VA for the right eyes is represented by solid lines, while the left eyes VA is represented by dashed lines. The graph’s bold line represents the mean value of VA

