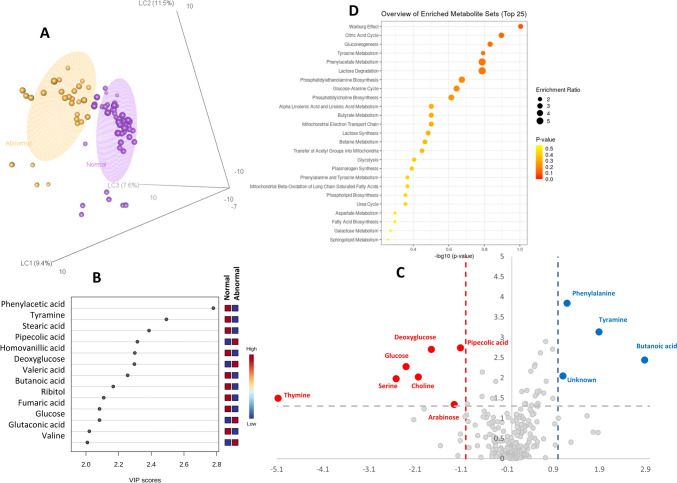
Fig. 3.
EndoPAT PLS-DA classification model: a abnormal (orange) vs normal (purple) score plot, axes represent the latent components, the amount of explained variance were reported in bracket. b Metabolites showing a VIP score > 1.5 in the PLS‐DA analysis. c Volcano plot reporting metabolite concentration fold changes and their statistical significance comparing normal vs abnormal EndoPAT. d Metabolite set enrichment analysis using the selected metabolites (VIP and Volcano) (Color figure online)

