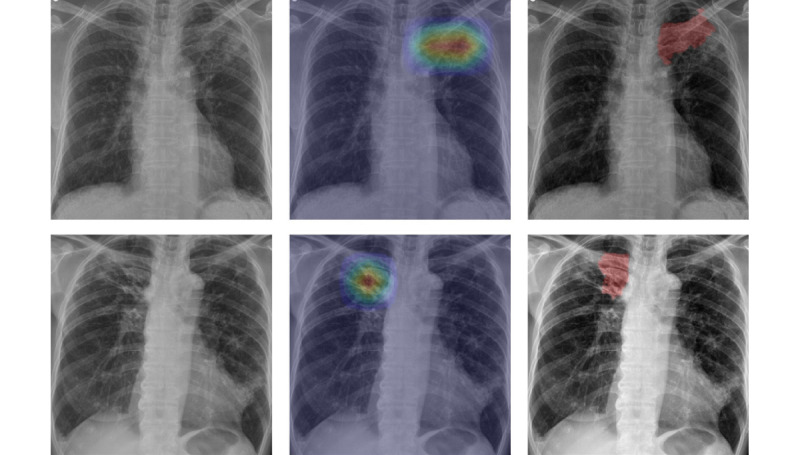
Figure 5.

Left: chest radiographs used for the analysis; middle: results of GradCAM; and right: results of LIME. Both the upper and lower panels display chest radiographs that were accurately identified as positive by the model. The analysis in the upper figure focuses on the left lung apex, while the analysis in the lower figure concentrates on the right lung apex, visualizing the areas of frequent tuberculosis occurrences. GradCAM: gradient-weighted class activation mapping; LIME: local interpretable model-agnostic explanations.
