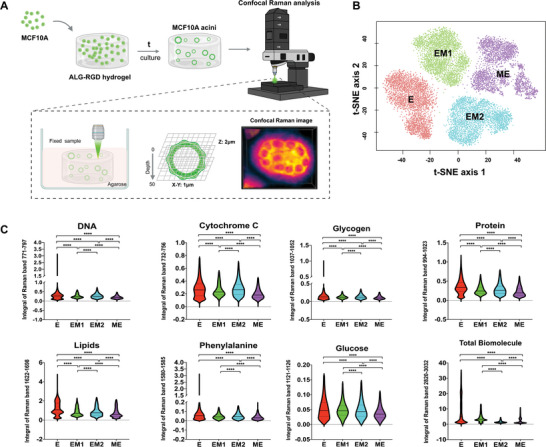
Figure 2.

Cell populations at different EMT/MET states present distinct biochemical profiles. A) Schematic representation of the Confocal Raman analysis work‐flow: after culture, whole‐mounted samples of E, EM1, EM2 and ME states were fixed, embedded in 1% agarose and directly imaged for quantitative chemometric phenotyping. B) Multivariate separation of acini‐like structures organoids spectra via t‐SNE depicts the differences among the four different EMT/MET states (E in red, EM1 in green, EM2 in blue, ME in purple). Data represents 1 single experiment, additional data for 3 individual experiments is presented in Figure S2C (Supporting Information). n = 3 spheroids per group). C) Volumetric analysis of Raman specific band intensity for different cell populations: Nucleic acids (771–797 cm−1), Cytochrome C (732–756 cm−1), Glycogen (1037–1052 cm−1), Proteins (994–1023 cm−1), Total Lipids (1622–1698 cm−1), Phenylalanine (1580–1585 cm−1), Glucose (1121–1126 cm−1) and Total Biomolecule (2820–3032 cm−1). Data refers to 3 individual experiments with several hundred‐thousand Raman spectra in each group (E: n = 373 275, EM1: n = 111 623, EM2: n = 336 399, ME: n = 370 649). Statistical analysis was performed using non‐parametric and unpaired Kruskal‐Wallis test (****p < 0.0001).
