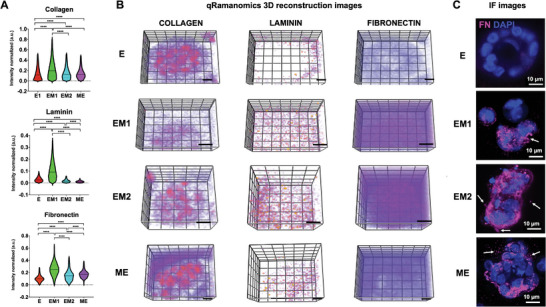
Figure 3.

Quantitative qRamanomics reveals differences in the quantity and spatial distribution of ECM proteins across different EMT/MET states. A) Quantitative qRamanomics of Collagen, Laminin and Fibronectin (n = 3 individual experiments). Statistical analysis was performed using non‐parametric and unpaired Kruskal‐Wallis test (****p < 0.0001). B) High‐content qRamanomics imaging of collagen, laminin and fibronectin. Scale bars, 10 µm. C) Representative immunofluorescence images of whole‐mounted samples of cells in E, EM1, EM2, and ME states stained for FN (magenta). Some FN deposition was also detected in the surrounding hydrogel matrix (white arrows). Please note that the two imaging techniques do not refer to the same sample.
