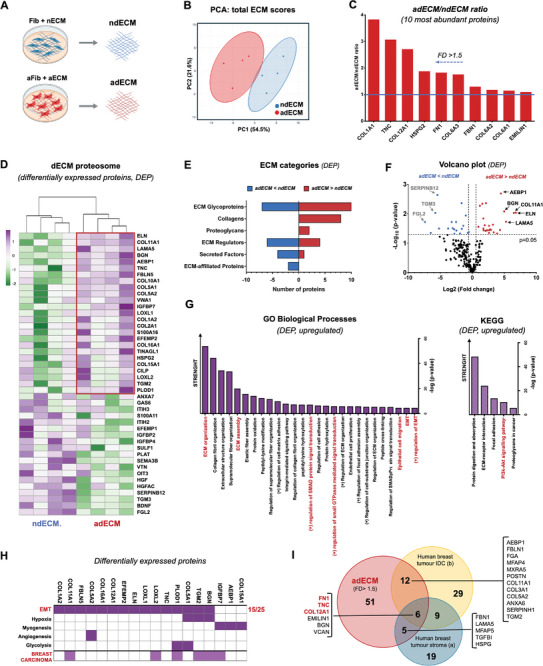
Figure 5.

The dECM from TGFb1‐activated fibroblasts partially mimics the composition of breast tumor matrices. A) Decellularized ECM obtained from TGFβ1‐activated fibroblasts and non‐treated (control) fibroblasts was solubilized and analyzed by LC‐MS/MS proteomics (n = 4 biological replicates). Created with BioRender.com. B) Principal component analysis of differentially expressed proteins. C) 10 most abundant proteins in adCEM versus ndECM. D) Heatmap with unsupervised hierarchical clustering analysis showing 25 up‐regulated and 16 down‐regulated proteins in adECM versus ndECM (FD >1.5 and FD <0.67 p‐value < 0.05). E) ECM associated categories of up and downregulated proteins in adECM versus ndECM. F) Volcano plot displaying the distribution of all ECM associated proteins with relative protein abundance Log2(FD, adECM versus ndECM, x‐axis) plotted against the significance level (‐Log10(p‐value), y‐axis) and highlighting significantly (p‐value <0.05) up‐regulated (red) and downregulates (blue) proteins. G) GO enrichment analysis, showing related “Biological Processes” and “KEGG”, hierarchically organized by ‐log(p‐value) (p‐value < 0.05) from EnrichR. H) Upregulated proteins associated with cancer processes exported from MSigDB Hallmark 2020 database and mammary carcinoma from DAVID database. I) Venn diagram comparing up‐regulated proteins detected in adECM with matrix proteins from mammary carcinomas reported in 2 different studies: a)[ 38 ] and b).[ 32 ]
