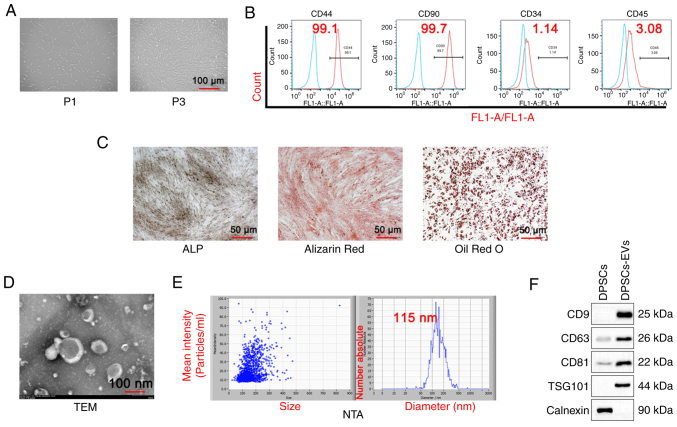
Figure 1.
Isolation and identification of DPSC and DPSC-EVs. (A) DPSCs were isolated, cultured and observed under a microscope. (B) Flow cytometry was performed to detect DPSC markers (CD44, CD90, CD34 and CD45). (C) ALP staining, Alizarin red staining and Oil Red O staining were performed to evaluate the osteogenic capacity of DPSCs. (D) The morphological features of DPSC-EVs were observed. The average size of EVs was 115 nm. (E) The NTA particle size of DPSC-EVs was analyzed. (F) Western blotting was performed to detect DPSC-EV markers (CD9, CD63, CD81, TSG101 and calnexin). Triplicate independent experiments were used. DPSC, dental pulp stem cell; EV, extracellular vesicle; NTA, nanoparticles tracking analysis; FL1, green fluorescent channel; P1,first generation DPSCs cells; P3, third generation DPSCs cells; TSG101,tumor susceptibility gene 101; TEM, transmission electron microscopy.

