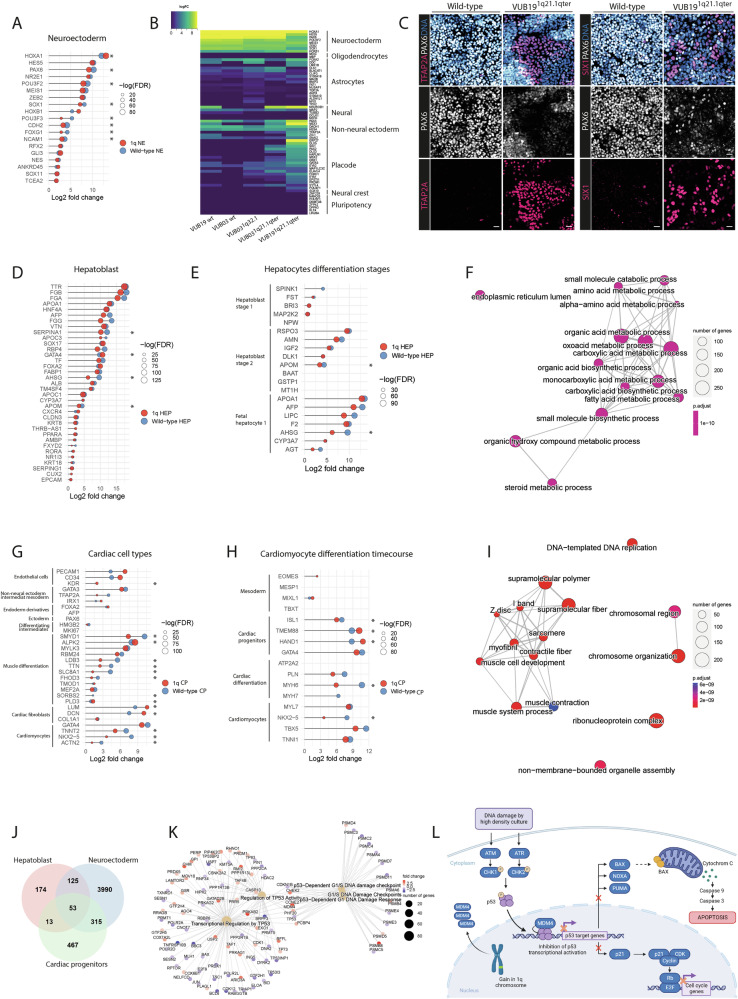
Fig. 2. hESC1q mis-specify to alternative cell fates during neuroectoderm differentiation and differentiate to more immature hepatoblasts and cardiac progenitors than hESCwt.
A Lollipop diagrams representing the differential gene expression of neuroectoderm markers in NEwt and NE1q vs undifferentiated cells. All genes shown in this panel and in (D, E, G and H) are differentially expressed with a log2fold-change over 0 and FDR < 0.05. B Heatmap representing the induction of expression of genes marking different ectodermal cell types and the undifferentiated hESC state in NE obtained from the five lines included in this study. C Representative images of the immunostaining of NEwt and NE1q for DNA (blue), PAX6 (white), TFAP2A (red, left panel) and SIX1 (red, right panel). D Lollipop diagrams representing the differential gene expression of hepatoblast markers in HEPwt and HEP1q vs undifferentiated cells. E Lollipop diagrams representing the differential gene expression of markers of different stages of hepatocyte differentiation in HEPwt and HEP1q vs undifferentiated cells. F Enrichment map showing the Top-15 deregulated pathways from gene ontology gene set enrichment analysis in HEPwt vs HEP1q. The size of nodes indicates the number of genes in each pathway and the color represents adjusted p-value. Pathways that cluster together have overlapping gene sets. G Lollipop diagrams representing the differential gene expression of genes marking different cardiac cell types in CPwt and CP1q vs undifferentiated cells. H Lollipop diagrams representing the differential gene expression of genes marking different stages of cardiomyocyte differentiation in CPwt and CP1q vs undifferentiated cells. I Enrichment map showing the top-15 deregulated pathways from gene ontology gene set enrichment analysis in CPwt vs CP1q. J Venn diagram showing the overlaps in differentially expressed genes between control and 1q-cells, for the three cell types with log2fold-change over 0 and FDR < 0.05. MDM4 is part of the core of 53 commonly deregulated genes. K Reactome pathway gene set enrichment analysis of the C2 library canonical pathways related to p53 signaling in NE, HEP and CP from 1q and wildtype cells. L Graphical summary of the model in which MDM4 has a higher expression because of the gain of 1q, resulting in an inhibition of the p53 signaling pathway and in turn decreasing the sensitivity of the cells to DNA damage.

