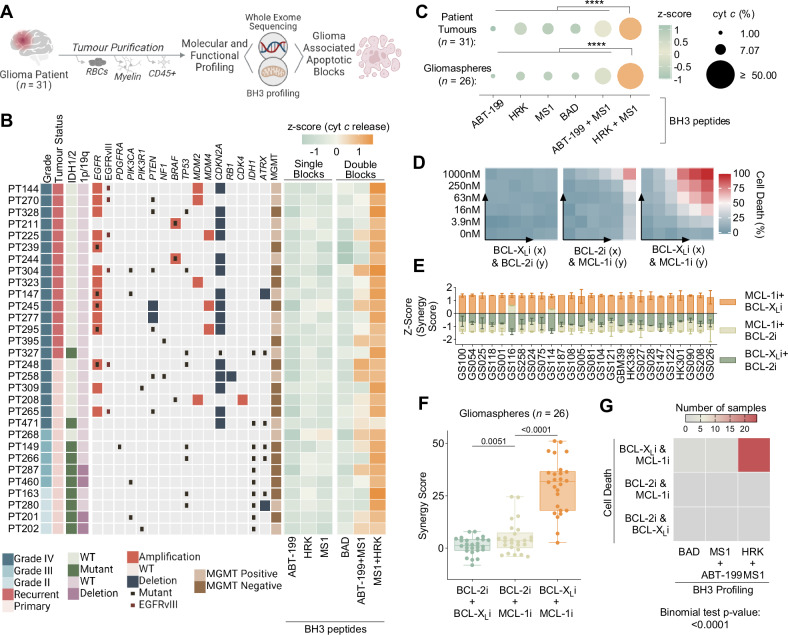
Fig. 1. Multiomic characterisation of the intrinsic apoptotic machinery in glioma patient and patient-derived samples.
A Workflow describing tumour purification and subsequent molecular (whole-exome sequencing) and functional (BH3 profiling) characterisation of glioma patient samples (n = 31). Also see Supplementary Table 1. B Heat maps describing patient sample clinical characteristics, copy number alterations and mutations of gene frequently alerted in GBM and BH3 profiling of the apoptotic blocks. C BH3 profiling is plotted as a z-score across the sample. Peptide concentrations are as follows: ABT-199: 1 µM (anti BCL-2), MS1: 10 µM (anti MCL-1), HRK: 100 µM (anti BCL-XL), BAD: 10 µM (anti BCL-2 and BCL-XL). BH3 profiling of anti-apoptotic blocks in patient tumours and gliomaspheres. Dot plot displays % cytochrome c release as dot size and z-score as dot color (n = 31 and n = 26, two-tailed, paired t test compares HRK + MS1 to all conditions). Also see Supplementary Fig. 1B. D Example heatmaps of cell viability (Cell Titer Glo) after 48 hours. of treatment with combinations of ABT-199 (BCL-2i), A-1155463 (BCL-XLi), and S63856 (MCL-1i) in gliomaspheres GS028. BH3 mimetics concentrations are as follows: 0 nM, 3.9 nM, 15.6 nM, 62.5 nM, 250 nM, 1000 nM. E Bar graphs (mean ± s.d.) of zip synergy scores plotted as a z-scores for gliomaspheres (n = 26). Synergy scores calculated from cell viability (Cell Titer Glo) experiments with combinations of BH3 mimetics: ABT-199 (BCL-2i), A1155463 (BCL-XLi), and S63856 (MCL-1i) (mean ± s.d., n = 2 experimental replicates). F Box and whiskers plot (mean, hinges at 25th and 75th percentiles, ± min to max) of synergy scores for each gliomasphere (n = 26), grouped by combinations of BH3 mimetics (two-tailed, paired t test). G Heat map displays summarizes highest scoring combination of cell death and BH3 profiling data for the 26 gliomaspheres. Statistics calculated using the binomial test. p > 0.05 = ns; p < 0.05 = *p < 0.01 = **p < 0.001 = ***p < 0.0001 = ****. See also Table S1 and Figure S1.

