Fig. 6.
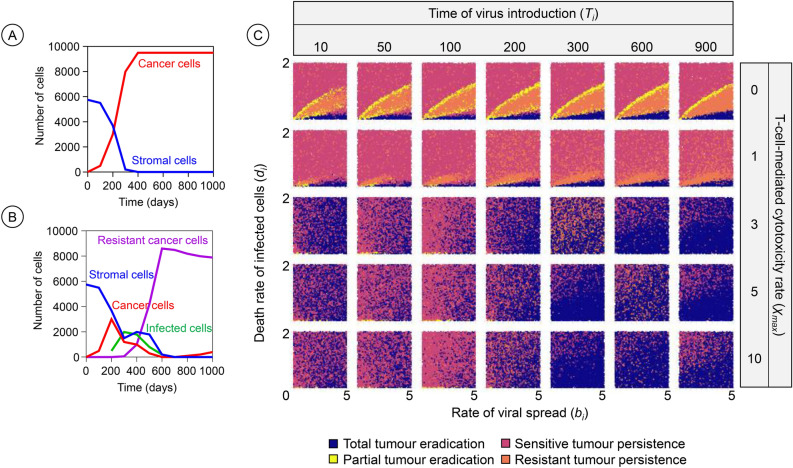
Effects of time of virus introduction and T-cell-mediated cytotoxicity on the therapeutic outcome. The frequency of infection-sensitive cancer cells (in red), healthy stromal cells (blue), infected cells (green), and resistant cancer cells (purple) over time is illustrated in the absence (A) and presence (B) of virotherapy (Ti = 200, bi = 1.2 and di = 0.1). (C) For a range of values of the rate of viral spread (bi) and the death rate of virus-infected cancer cells (di) the panels show how the outcome of oncolytic virotherapy is affected by the introduction time of the virus (Ti , organised in columns) and the level of anticancer T-cell-mediated cytotoxicity (, organised in rows). The graph with Ti = 50 and = 0 corresponds to Fig. 2A, depicting the outcomes in the absence of an immune response. For each graph in the figure, 10,000 simulations were run for parameter combinations (bi, di) chosen randomly within the specified range. Each simulation is represented by a point, the colour of which indicates the therapeutic outcome. All model parameters were kept at their default values except the ones under investigation.

