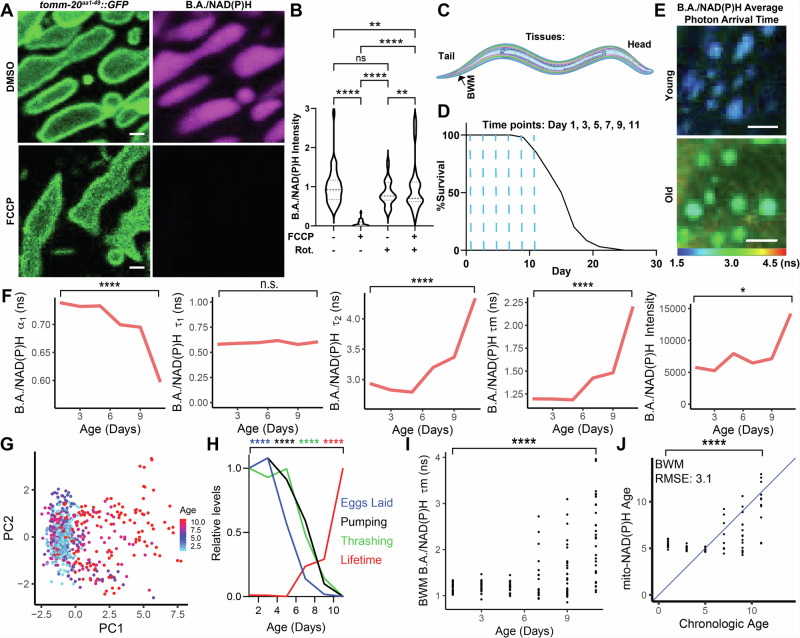
Fig. 1. Non-destructive, label-free and subcellular resolution quantification of aging based on mitochondrial B.A./NAD(P)H FLIM.
A,B. Images and analysis of B.A./NAD(P)H (magenta) and TOMM-20aa1-49::GFP (green) in BWM cells of Day 1 adult C. elegans treated with either 10 mM FCCP and/or 10 mM rotenone for 5–15 min. B shows quantification of mitochondrial B.A./NAD(P)H fluorescence intensity (n = 25–40 C. elegans per condition; Two-way ANOVA with post-hoc Tukey’s test). C,D Schematic of imaging location in the C. elegans body € and time points (D; blue dashed lines) imaged for analyzes presented in Fig. 1E–J. n = 100 C. elegans in the lifespan. E WT B.A./NAD(P)H average photon arrival time images of C. elegans BWM cells in either young (Day 1) or old (Day 11) C. elegans. F C. elegans were imaged using B.A./NAD(P)H FLIM at Day 1, 3, 5, 7, 9 and 11 in BWM cells and then analyzed as described in Fig. S2A. Graphs depict the median value across animals imaged for each endpoint at each age respectively (n = 17–32 C. elegans per condition; moderated t test; median). G PCA of non-redundant BWM B.A./NAD(P)H FLIM endpoints (α1, Ƭ1, Ƭ2 and intensity) of individual mitochondria colored by age. Each dot represents an individual mitochondrion (n = 67-128 mitochondria across 17–32 C. elegans per condition; points represent distinct mitochondria). H Plot of relative BWM B.A./NAD(P)H lifetimes (red), pumping rate (black), thrashing rate (green), and egg laying (blue) across age in C. elegans (n = 17–32 C. elegans per condition; moderated t test (B.A./NAD(P)H FLIM), Student’s t test (all other comparisons); median (B.A./NAD(P)H FLIM), mean (all other comparisons)). I Plot of age versus BWM B.A./NAD(P)H lifetime. Each dot represents an individual C. elegans (n = 17–32 C. elegans per condition; moderated t test). J LASSO regression models generated with B.A./NAD(P)H FLIM endpoints from BWM mitochondria. Plots depict age predicted by the model (Mito-NAD(P)H Age) versus chronological age. The blue line indicates when predicted age hypothetically matches chronologic age. RMSE stands for root mean square error. Each dot represents one C. elegans (n = 157 C. elegans used to train the model; Student’s t test; points represent distinct C. elegans). Scale bars, 1 µm (A) 10 µm (E). ****p < 0.0001, **p < 0.01, *p < 0.05.

