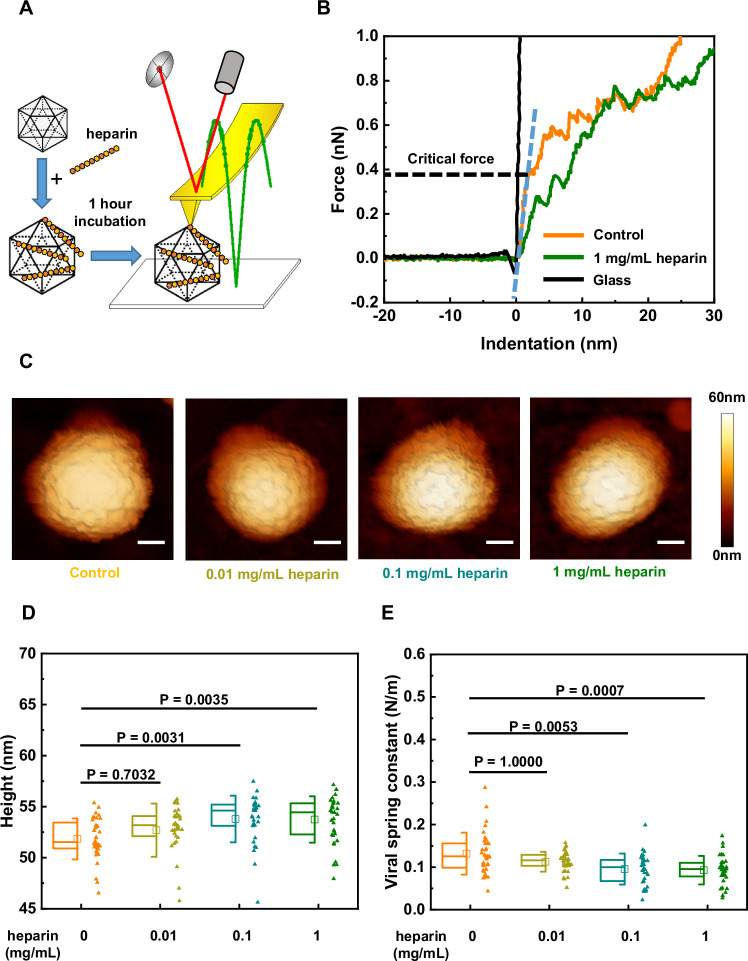
Fig. 2. Heparin triggers softening and enlargement of HPV16 PsVs in a dose-dependent manner.
A Schematic of the AFM setup. HPV16 PsVs were incubated with different concentrations of heparin for 1 h and then imaged and indented by AFM in liquid. B Typical force-indentation curves were acquired by using an AFM tip to indent a single HPV16 PsV under the indicated condition. The black curve was acquired by using an AFM tip to indent the glass substrate as a reference. The blue dashed line marks the linear phase on the approach line of the force-indentation curve used for linear fitting. The black dashed line represents the ordinate value at the endpoint of the linear phase, where the critical force of the particle was measured. C Typical AFM images of the PsVs incubated with the indicated concentrations of heparin before indentation. The scale bar is 20 nm. D Comparison of the height of the PsVs treated with different heparin concentrations. E Comparison of the stiffness of the PsVs treated by different concentrations of heparin. The significance level is 0.05 with Bonferroni correction for multiple comparisons. P = 1.0000 is due to Bonferroni correction. The number of data points (n) for the control group and the heparin-treated groups at concentrations of 0.01 mg/mL, 0.1 mg/mL, and 1 mg/mL are as follows: control group (N = 36), 0.01 mg/mL (N = 35), 0.1 mg/mL (N = 34), and 1 mg/mL (N = 36). The square in the box plots indicates the mean (also printed in Supplementary Table S1), the top and bottom of the box are the 25th and 75th percentiles, respectively, and the whiskers represent the standard deviation. The line in the box indicates the median. Source data are provided as a Source Data file.

