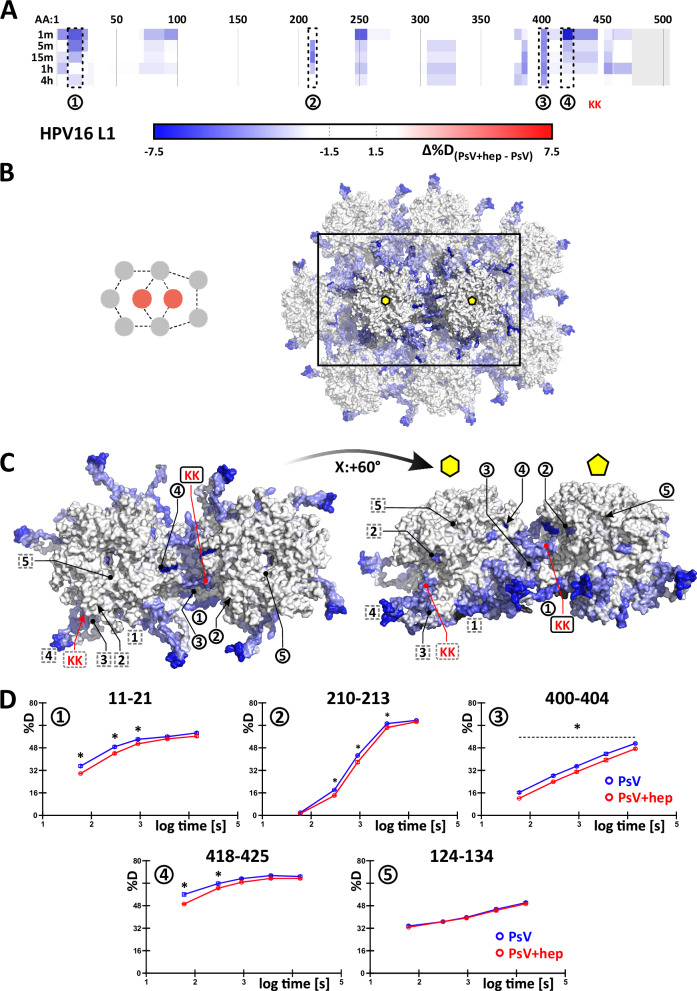
Fig. 5. HDX-MS shows lowered deuteration inside the intercapsomer groove in the presence of heparin.
A A subset of peptides describing all the observed changes during multipoint HDX-MS experiment are shown along the L1 protein sequence. Blue regions display decreased deuteration in the presence of heparin, and a grey area denotes missing data. Maximal observed differences are visualised symmetrically on the cryo-EM HPV16 structure (pdb: 7kzf). Capsomers in hexavalent and pentavalent coordination are shown in a broader context (B) and isolated (C). Regions for which example deuteration uptake plots are shown in (D) are marked on the asymmetric unit’s chain “A” (forming the pentavalent capsomer) – black circles and on the asymmetric unit’s chain “C” (part of the hexavalent capsomer), which is rotated about Z: + 144° from the intercapsomer interface shown in (C) around the centre of the hexavalent capsomer - grey dashed squares. Black regions on the structure denote missing data in (B and C). Red marks the location of the K442/K443 patch, asterisk denotes statistical significance as described in the text. Region 5 shows an example peptide with no observed changes to exclude non-specific deuteration decreases across the whole particle. In (D) N = 3 replications (on the deuterium labelling level). The plots in (D) show mean value ± standard deviation with corresponding error bars mostly below the size of the point. The significant differences are determined by a two-tailed unpaired parametric T test with a single pooled variance (α ≤ 0.05, with Holm-Sidak multicomparison correction). Source data are provided as a Source Data file.

