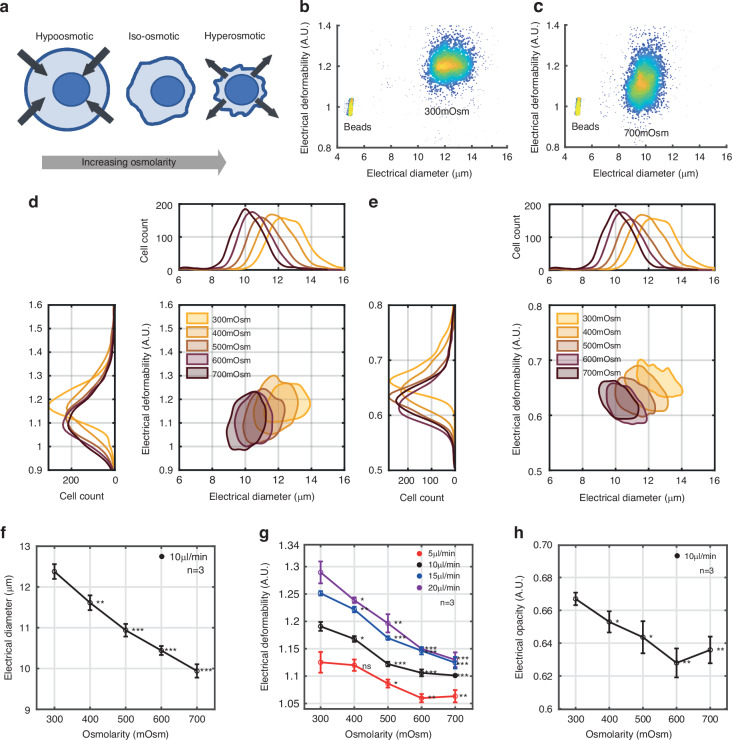
Fig. 3. Effect of osmotic pressure on cell deformability and opacity.
a Increasing the osmotic pressure causes cells to shrink leading to an increase in membrane folds. b and c example density scatter plots of electrical deformability vs electrical diameter for 300 mOsm and 700 mOsm buffers at a flow rate of 10 μl/min. d Contour plots (50% density) of electrical deformability vs electrical diameter for different osmolarities (flow rate 10 µl/min). e electrical opacity vs. electrical diameter for different osmolarities (flow rate 10 µl/min). Data is representative of one experiment. f Mean electrical diameter as a function of osmolarity (n = 3). g Mean electrical deformability as a function of osmolarity for different flow rates (n = 3). h Electrical opacity vs osmolarity at a flow rate of 10 µl/min, (n = 3). P-values (student’s t-test) are relative to cells measured at isotonic osmolarity (300 mOsm). ***p < 0.001, **p < 0.01, *p < 0.05, and ns not-significant. Number of cells in each group is approximately 2000

