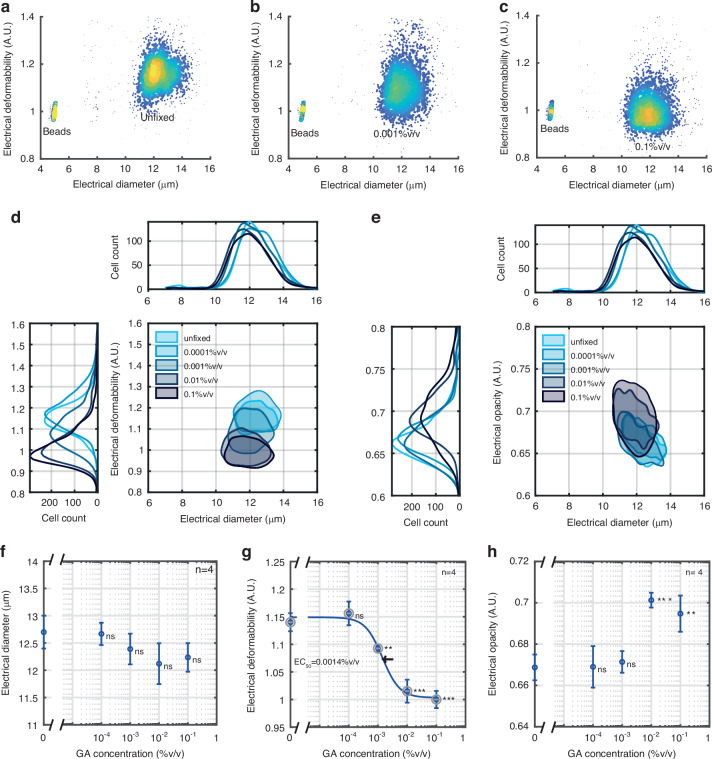
Fig. 4. Effect of glutaraldehyde on cell deformability and opacity.
Example density plots of electrical deformability as a function of the electrical diameter for (a) unfixed, (b) 0.001% v/v and (c) 0.1% v/v GA fixed HL60 cells at a flow rate of 5 μl/min. Contour plots (50% density) of electrical deformability (d) and electrical opacity (e) vs electrical diameter. Dose-response data for electrical diameter (f), electrical deformability (g) and electrical opacity (h) at 5 μl/min. Error bars are standard errors of the mean for n = 4. P-values (Student’s t-test) are relative to unfixed cells (0%v/v). EC50 for electrical deformability = 0.0014% v/v. The number of cells in each group was approximately 2000

