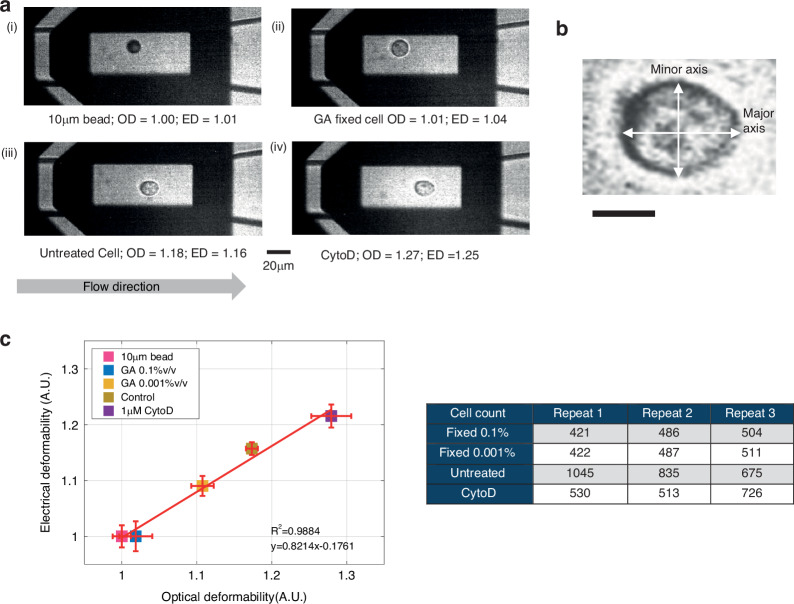
Fig. 6. Correlation between electrical and optical deformability.
a Optical images of particles and cells at the end of a channel at a flow rate of 10 μl/min. Images were recorded with a camera with cell contours and deformability extracted from the images off-line. Optical Deformability (OD) of the individual particles are shown (i) Solid particle (ii) GA fixed HL60 cells (iii) Control (untreated) cell (iv) CytoD treated cell. b Example image of a single HL60 cell deforming in the channel at a flow rate of 10μl/min; scale bar = 10 µm. c Correlation between the Electrical Deformability (ED) and Optical Deformability (OD) for HL60 cells (Control, GA and CytoD treated) together with 10 μm solid particles. Data is the mean of 3 biological repeats (n = 3). The correlation between the two methods is given by the solid line (R2 = 0.99)

