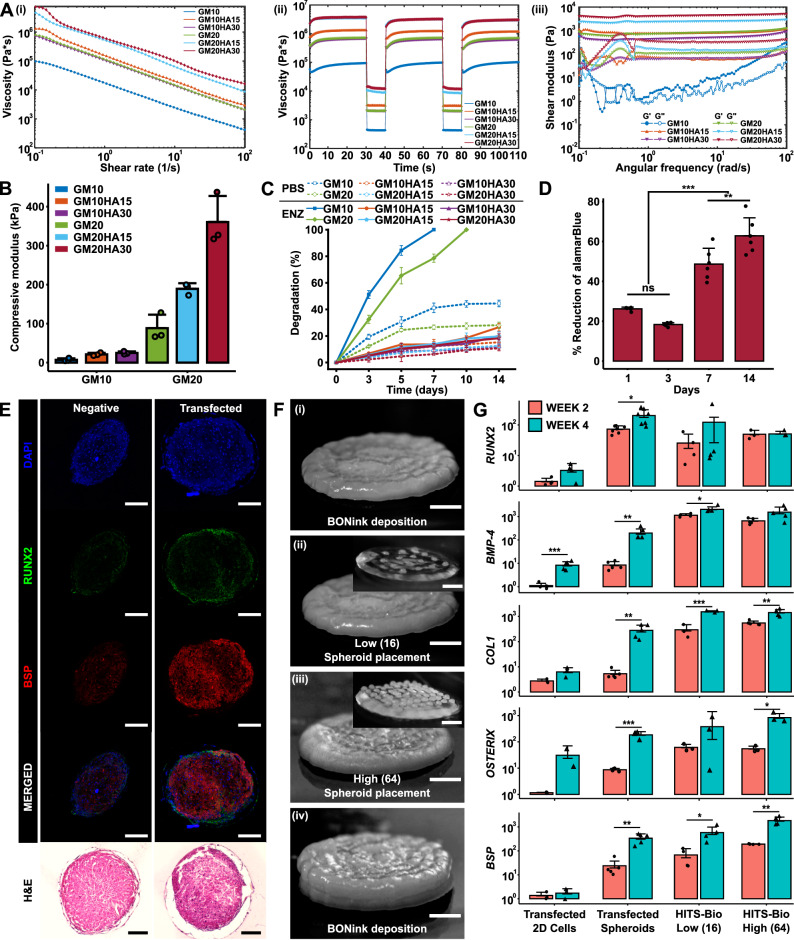
Fig. 3. In vitro characterization of bioinks.
A Rheological characterization of BONink and CARink at different concentrations of HA and GM (n = 3 independent rheological characterizations, data are presented as mean): (i) Flow curves of bioinks from the rotational test at a shear rate ranging from 0.1 to 100 s-1 showing mean plots. (ii) Recovery behavior and viscosity measurements at five intervals at alternating shear rates (shear rate of 0.1 s-1 for 30 s and 100 s-1 for 10 s) showing mean plots. (iii) Measured shear modulus from frequency sweeps at an angular frequency ranging from 0.1 to 100 rad s-1. B Compressive modulus (n = 3 independent samples), (C) % degradation of samples for 14 days in enzyme (ENZ) and PBS (n = 3 independent samples), and (D) % reduction of alamarBlue to assess cell viability with GM20HA30 for 14 days (n = 6 biologically independent samples, one-way ANOVA, Day 1 vs. Day 3 p = 0.140902, Day 7 vs. Day 14 p = 0.003054, all other shown comparisons p < 0.0001). E Histomorphometric characterization of non-transfected and miR-(196a-5p + 21) co-transfected spheroids stained for RUNX2, BSP, and H&E at Week 4 (scale bar: 100 µm). F Steps involved during the bioprinting process for in vitro fabrication of bone constructs at two different spheroid densities: (i) BONink deposition, (ii) bioprinted spheroids at low (16 spheroids) and (iii) high density (64 spheroids), and (iv) overlaying bioprinted spheroids with another layer of BONink. Scale bar: 1 mm. Inset images demonstrate bioprinted spheroids with low and high densities on a transparent gel (CARink) for clear visualization. Scale bar: 1 mm. G Quantification of RUNX2 (n = 4, 7, 4, 3 biologically independent samples (from left to right), unpaired two-sided Student’s t-test, p = 0.06978, 0.01004, 0.42355, 0.92376 from left to right), BMP-4 (n = 5, 5, 4, 5 biologically independent samples (from left to right), unpaired two-sided Student’s t-test, p = 0.00092, 0.00505, 0.03519, 0.06384 from left to right), COL1 (n = 3, 5, 3, 5 biologically independent samples (from left to right), unpaired two-sided Student’s t-test, p = 0.08064, 0.00395, 0.00069, 0.00178 from left to right), OSTERIX (n = 2, 4, 3, 3 biologically independent samples (from left to right), unpaired two-sided Student’s t-test, p = 0.27645, 0.00041, 0.26759, 0.02095 from left to right), and BSP (n = 3, 5, 4, 4 biologically independent samples (from left to right), unpaired two-sided Student’s t-test, p = 0.54175, 0.00147, 0.04690, 0.00367 from left to right) gene expression of bioprinted bone. Unless otherwise noted, data are presented mean ± SD where *p < 0.05, **p < 0.01, ***p < 0.001, and ns not significant. Source data are provided as a Source Data file.

