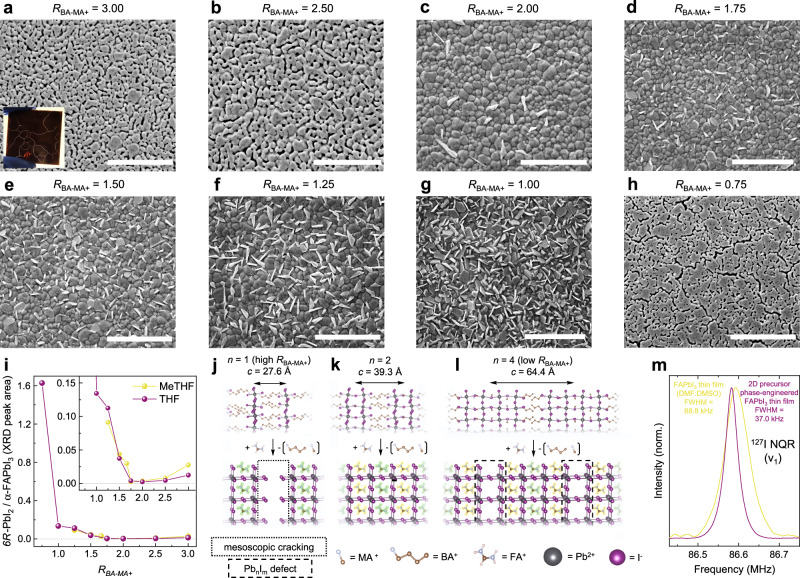
Fig. 3. Optimal 2D intermediate.
Scanning Electron Microscopy (SEM) images showing the microstructure of 2D-intermediate α-FAPbI3 layers when a series of 2D intermediate processed from THF with varying RBA-MA+ are converted sequentially. RBA-MA+ = (a) 3.00 (inset: photograph showing macroscopic cracking of 3D perovskite layers converted from RBA-MA+ = 3.00 intermediates due to extreme volume contraction), (b) 2.50, (c) 2.00, (d) 1.75, (e) 1.50, (f) 1.25, (g) 1.00, (h) 0.75. Scale bars: 5 μm. Schematic diagrams depicting the conversion of (i) BA2PbI4 (n = 1) (j) BA2MAPb2I7 (n = 2), and (k) BA2MA3Pb4I13 (n = 4) into 3D α-FAPbI3. FA+ highlighted in green has replaced BA+ in the organic channels of the 2D intermediate, while FA+ highlighted in yellow has replaced MA+ in the inorganic layers. Double-headed arrows display layer thickness. l Plot showing lead iodide (PbI2) content as a phase fraction in comparison to 2D-intermediate α-FAPbI3 extracted from XRD diffraction patterns (Supplementary Fig. 15) via peak integration of 6R-PbI2 (001) and α-FAPbI3 (100) scattering peaks. Inset shows an expanded view for low-PbI2 region. m 127I nuclear quadrupole resonance (NQR) spectra of 2D-intermediate FAPbI3 and FAPbI3 (processed from DMF:DMSO) thin films, which have been mechanically exfoliated and powdered for measurement.

