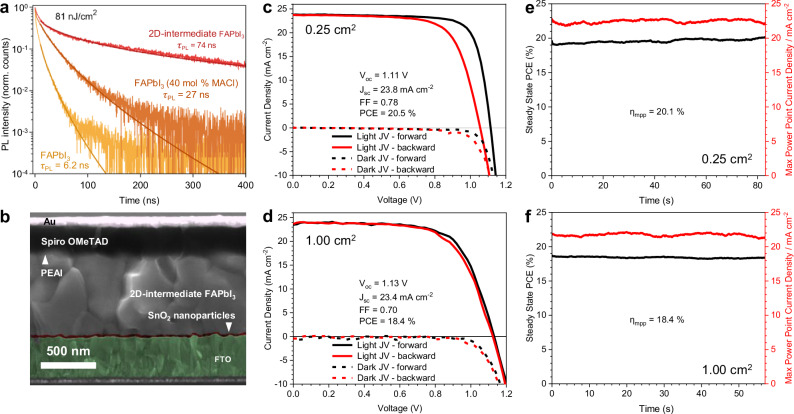
Fig. 4. PSC Operational Performance.
a Time-resolved photoluminescence (PL) transients of FAPbI3 materials made using different fabrication methods. PL was detected at 810 nm following pulsed-laser excitations (398 nm at 2.5 MHz repetition rate) at an excitation fluence of 81 nJ cm-2. PL lifetimes, τPL, determined by stretched exponential fits are shown on the figure labelling. Solid lines are stretched-exponential fits to the measured data. b Cross-sectional scanning electron microscopy image of PSC fabricated utilising 2D precursor phase-engineered α-FAPbI3. J-V characteristics and corresponding maximum power point tracked efficiency (ηmpp) and current density (Jmpp) measured at maximum power point for champion devices fabricated from 2D precursor phase-engineered α-FAPbI3 with illuminated area 0.25 cm2 (c, e) and 1.00 cm2 (d, f). Light J-V and ηmpp measurements were performed under simulated AM1.5 100.7 mWcm-2 irradiance, accounting for the spectral mismatch factor. Jsc = short-circuit current density, Voc = open-circuit voltage, FF = fill factor, Vmpp = maximum power point voltage.

