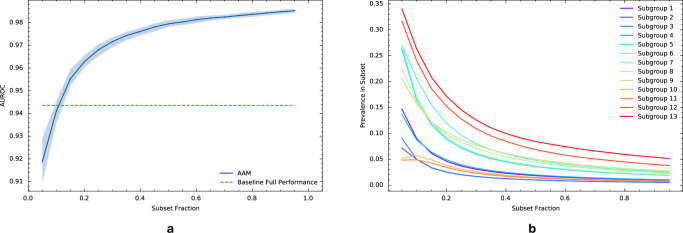
Fig. 2. Performance analysis of the AAM-inspired model as subgroup prevalence changes.
a Performance stability curve for the AAM-inspired model under a shift in patient subgroup prevalence as measured by area under the ROC curve (AUROC). The blue curve plots the AUROC of the AAM-inspired model on the worst-case subset of a given size (x-axis; the fraction of the whole evaluation dataset). The worst-case subset is determined algorithmically based on the AAM-inspired model’s expected loss conditional on a set of 91 patient characteristics. The shaded region denotes a 95% bootstrap confidence interval derived from 100 resamples. The green dashed line denotes a minimum performance threshold that was selected based on the performance of an existing model. b Prevalence of subgroups with poor performance extracted by AFISP vs. subset fraction. While these subgroups are rare in the full dataset (subset fraction = 1), they become more common in smaller worst-case subsets.

