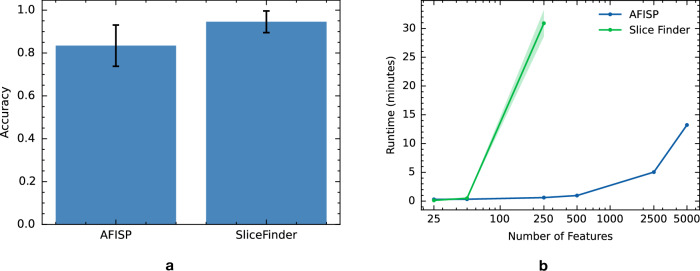
Fig. 6. Accuracy and efficiency of subgroup discovery methods on simulated data.
a Results from a synthetic data experiment in which a poorly performing subgroup was manually defined for the given prediction model. The bar plot reports AFISP and SliceFinder’s accuracy (percent of times that each method found the problematic subgroup). Error bars represent 95% Wilson score intervals from 50 trials. b Runtime in minutes of each method vs the number of binary features (on log scale). Shaded regions represent one standard error from five repetitions.

