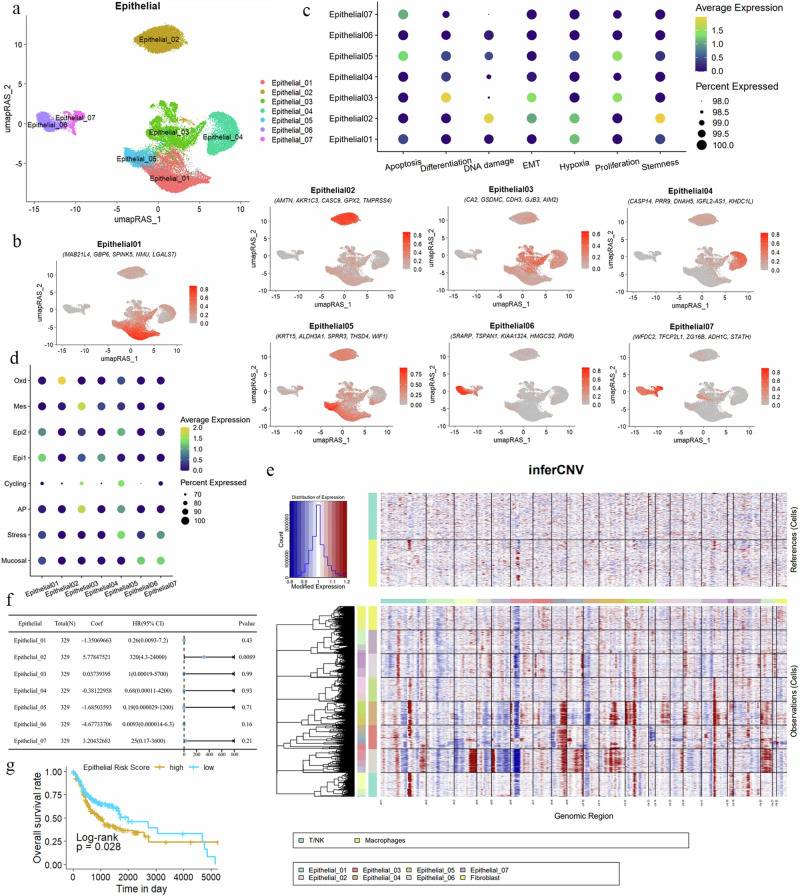
Fig. 4. Redefinition of OSCC malignant epithelial cells from the perspective of GRN.
a UMAP dimensionality reduction reveals that epithelial cells in OSCC are divided into seven distinct subgroups. b Specific marker genes for the epithelial cell subgroups are displayed, showing the five most significantly expressed genes in each subgroup. c A dot plot illustrates the gene expression related to processes such as apoptosis, proliferation, differentiation, DNA damage, hypoxia, stemness, and EMT in the seven epithelial cell subgroups. The color indicates the average expression intensity, while the size of the dots represents the proportion of expression. d Functions of epithelial cell subgroups based on specific biomarkers are depicted, highlighting characteristics such as mucosal properties, stress response, and antigen presentation. e A heatmap displays the CNV within the epithelial cell subgroups. Red indicates chromosomal amplification, blue indicates chromosomal deletion, with the X-axis representing chromosome numbers and the Y-axis representing the cell clusters included in the analysis. T/NK cells and macrophages are used as reference genomes. f Multivariate Cox regression analysis calculated the risk scores of epithelial cell subgroups for OSCC. For patients (n = 329), the coefficient (coef) represents the partial regression coefficient. A hazard ratio (HR) > 1 is considered a risk factor. g Kaplan–Meier curves show the relationship between the risk scores of epithelial subgroups and patient survival rates. A higher risk score correlates with poorer survival outcomes (P = 0.028). The Y-axis represents the probability of patient survival, and the X-axis represents patient survival time.

