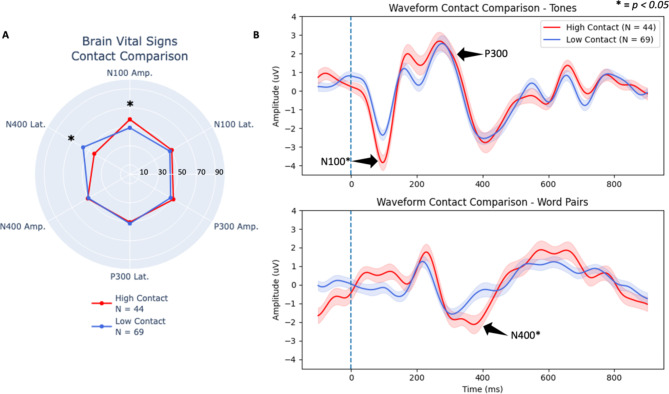
Fig. 2.
(A) Overall group (female and male combined) brain vital sign radar plot comparing high- versus low-contact groups. (B) Group-level grand average ERP waveforms from tones (top) and word pairs (bottom) for overall group comparing high- versus low-contact group differences. Deviant tones and incongruent word pair waveforms are plotted, with standard error shaded. N100, P300, and N400 brain vital sign components of the high-contact group are highlighted with labels and arrows. Asterisks denote significant effects in both the brain vital sign and waveform results.

