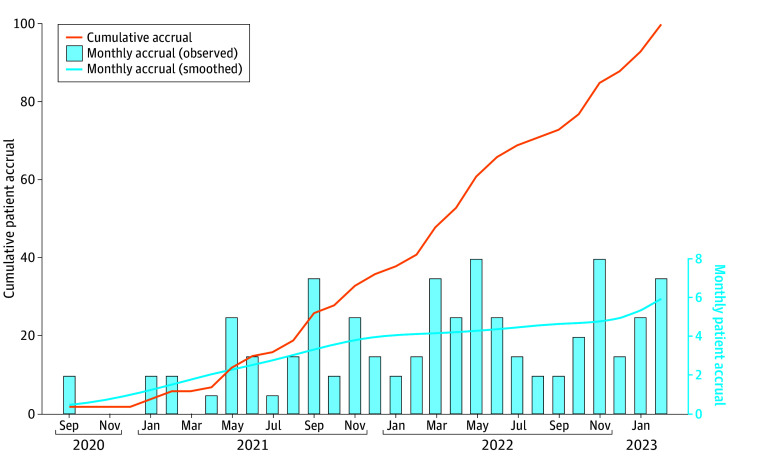
Figure 2. Cumulative and Monthly Accrual in the Lead-In Pilot Phase .
The cumulative accrual curve (solid line) depicts the total number of patients randomized by the end of each month. The bars indicate the number of patients randomized in each month, and the dashed line indicates estimated monthly accrual rate using locally weighted scatterplot smoothing. The monthly accrual rate reached 5.9 patients per month in February 2023, exceeding the prespecified feasibility threshold of 5.6 patients per month.

