Figure 4.

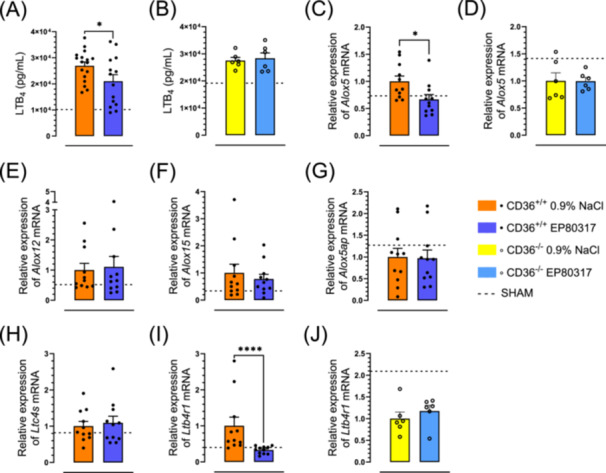
EP 80317 decreases arachidonic acid metabolites‐LTB4. (A) Bar graph and dot plot represent the LTB4 levels in lung homogenates of CD36+/+ and (B) CD36‐/‐ mice. (C) Relative expression of Alox5 mRNA in lung tissue of CD36+/+ and (D) CD36‐/‐ mice. Bar graph and dot plot represent the relative expression of (E) Alox12, (F) Alox15 and (G) Alox5ap mRNA in lung tissue of CD36+/+ mice. (H) Bar graph and dot plot of the relative expression of Ltc4s mRNA in lung tissue of CD36+/+. (I) Bar graph and dot plot represent the relative expression of Ltb4r1 mRNA in lung tissue of CD36+/+ and (J) CD36‐/‐ mice. Data are mean ± SEM. *p < 0.05 and ***p < 0.001, as assessed by an unpaired t test. n = 14 for CD36+/+ and n = 6 for CD36‐/‐.
